Demographic Exploration of Results: Long-term impacts of COVID-19 on young people in Scotland

In partnership with the Scottish Youth Parliament, and YouthLink Scotland, we’ve published an expanded version of the #LockdownLowdown: ‘What young people in Scotland think about their lives as lockdown restrictions change’ report.
This new report gives a deeper insight into how young people feel about their education, relationships, rights, and more, as lockdown restrictions change.
In recognition that the impact of lockdown will be long-term, the Scottish Government commissioned a follow-on #LockdownLowdown survey that ran between September and November 2020 and received over 6,000 responses. This activity ran alongside focus groups held by the Scottish Youth Parliament with young people whose voices are seldom heard.
In December 2020, we launched the Key Findings Report, providing stakeholders with the top-line results of what young people are worried about, and the long-term impact that COVID-19 is having on their lives.
Some of the key findings include:
When asked if their educational establishment had reopened in a safe way, respondents in more affluent areas agreed with this statement more than those in other areas.
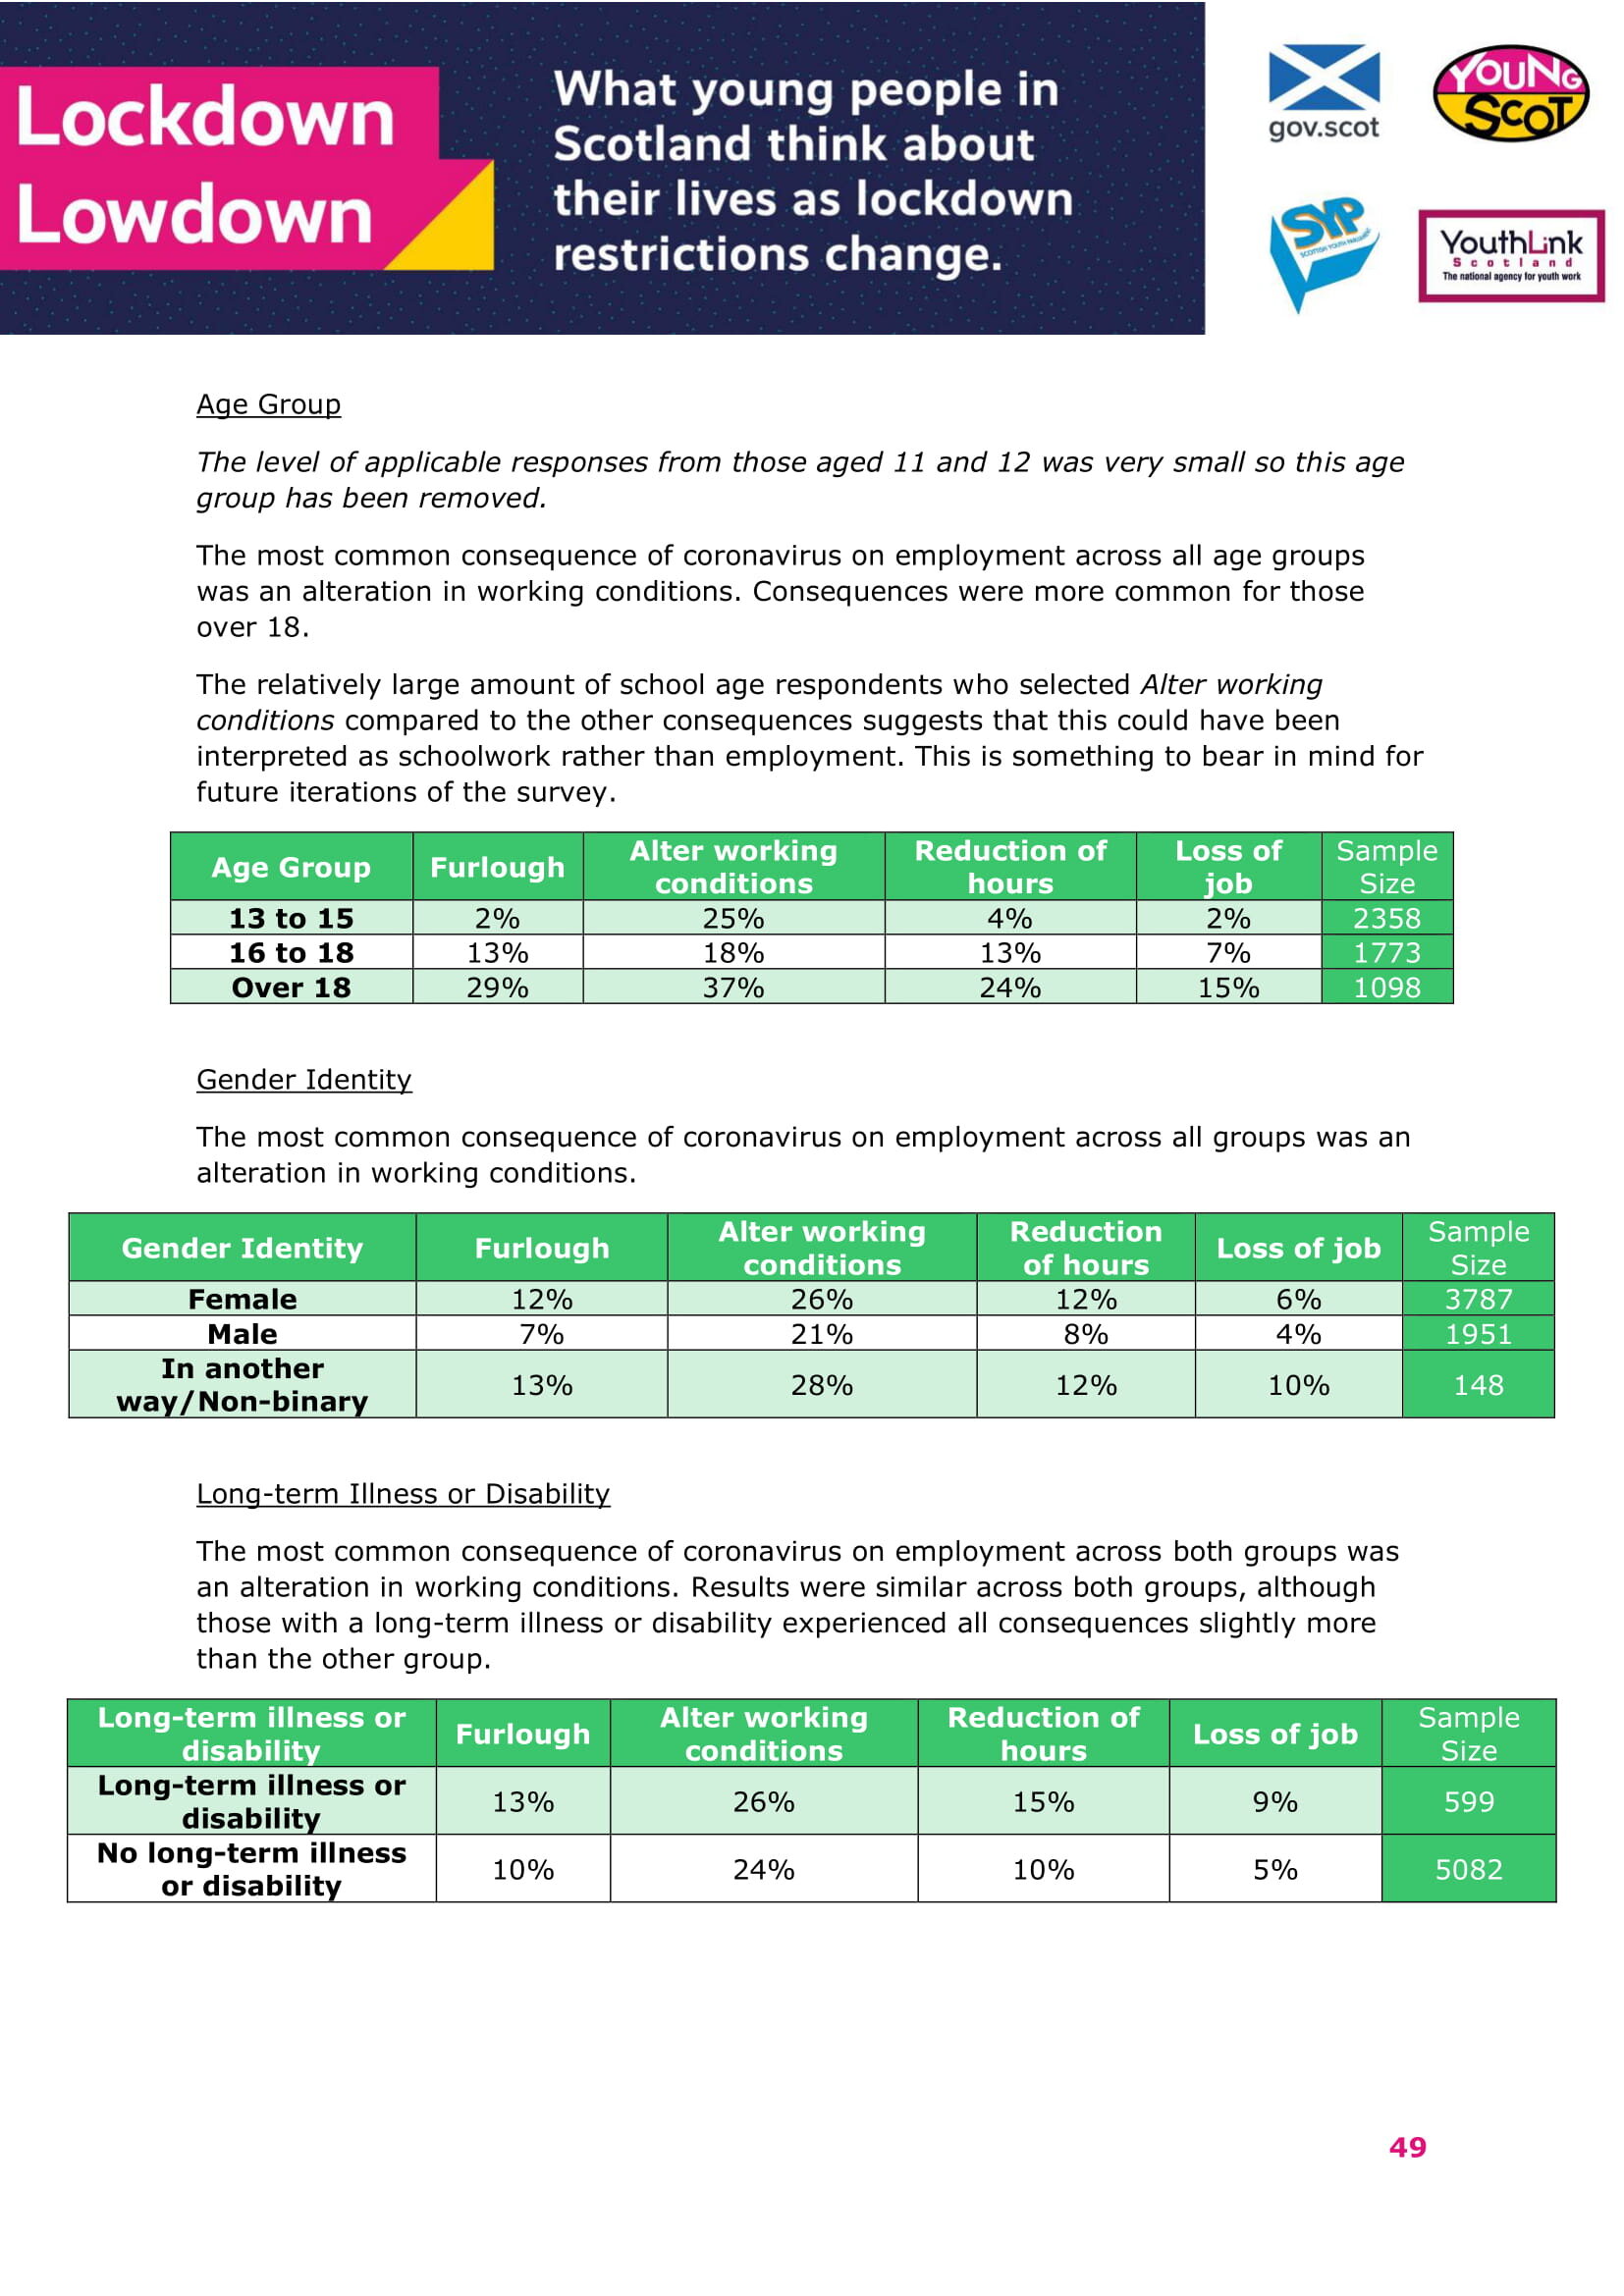
Young people aged 11 & 12 were most concerned about missing out on learning or having difficulty with online learning. Respondents over 18 also mostly expressed difficulty with learning online, with much more responses for this theme compared to others.
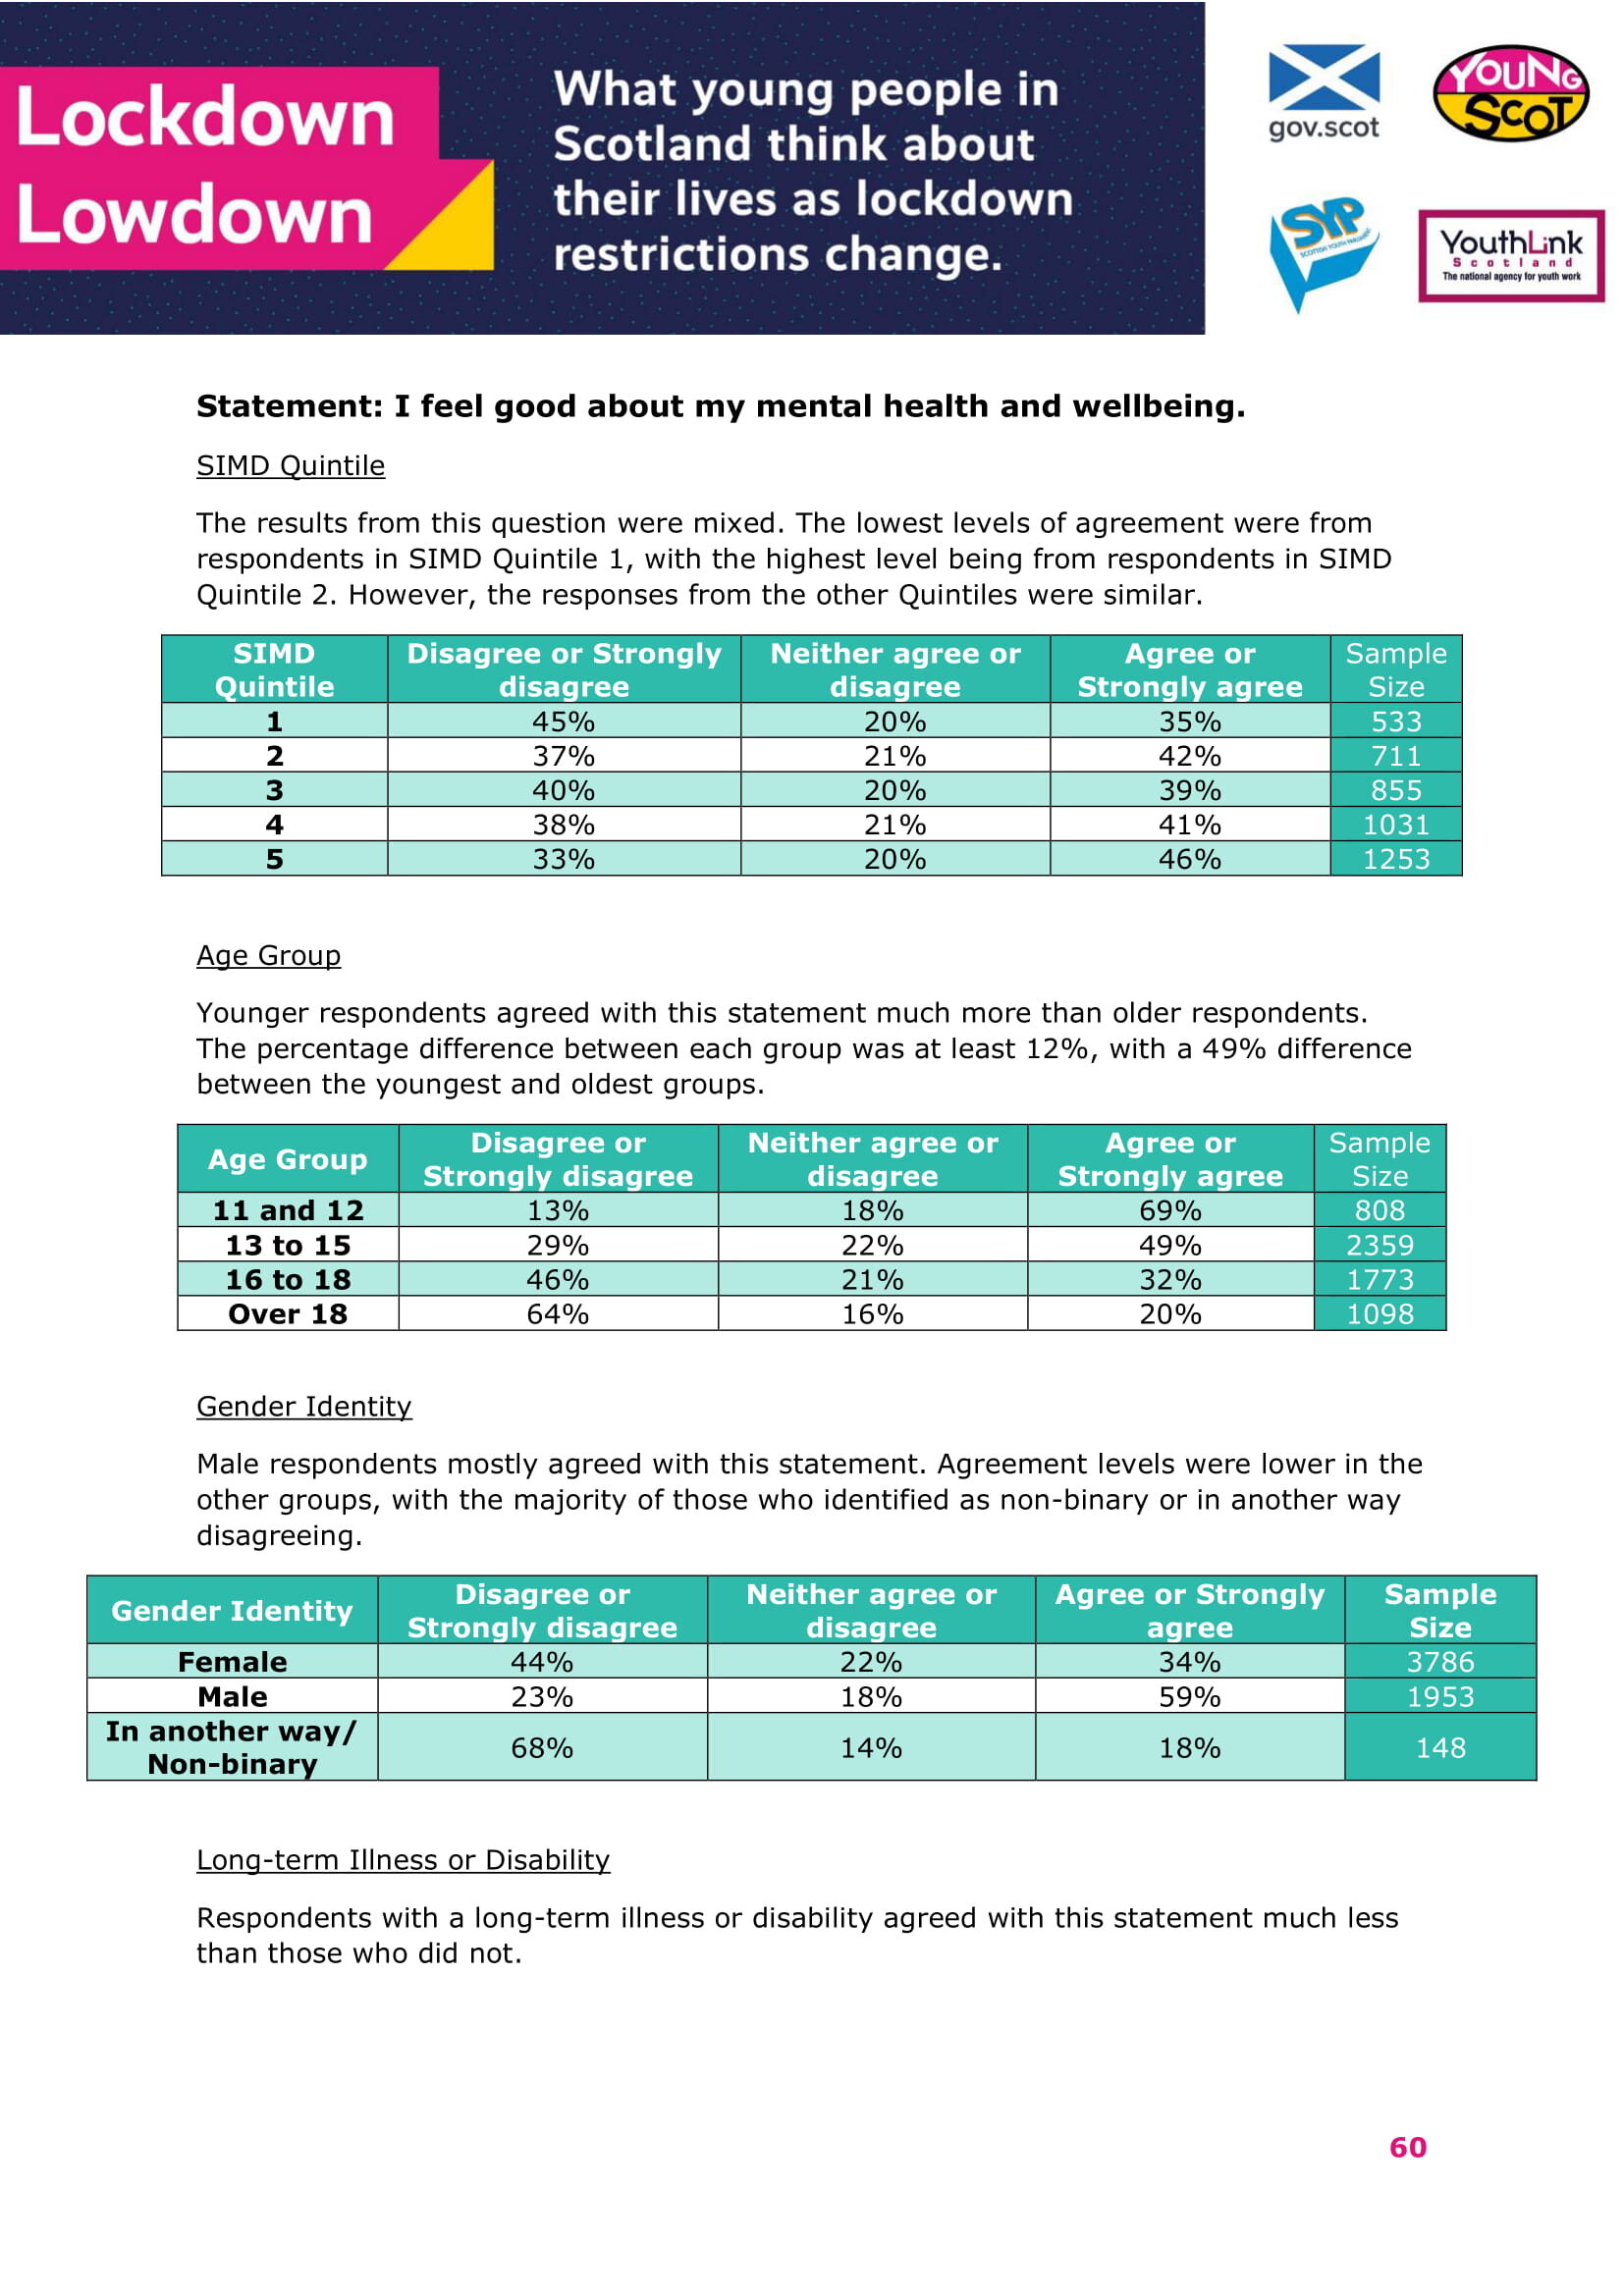
Male respondents were substantially more likely to agree that they felt good about their mental health & wellbeing (59%) than female respondents (34%) and respondents who identified as non-binary or in a different way (18%).
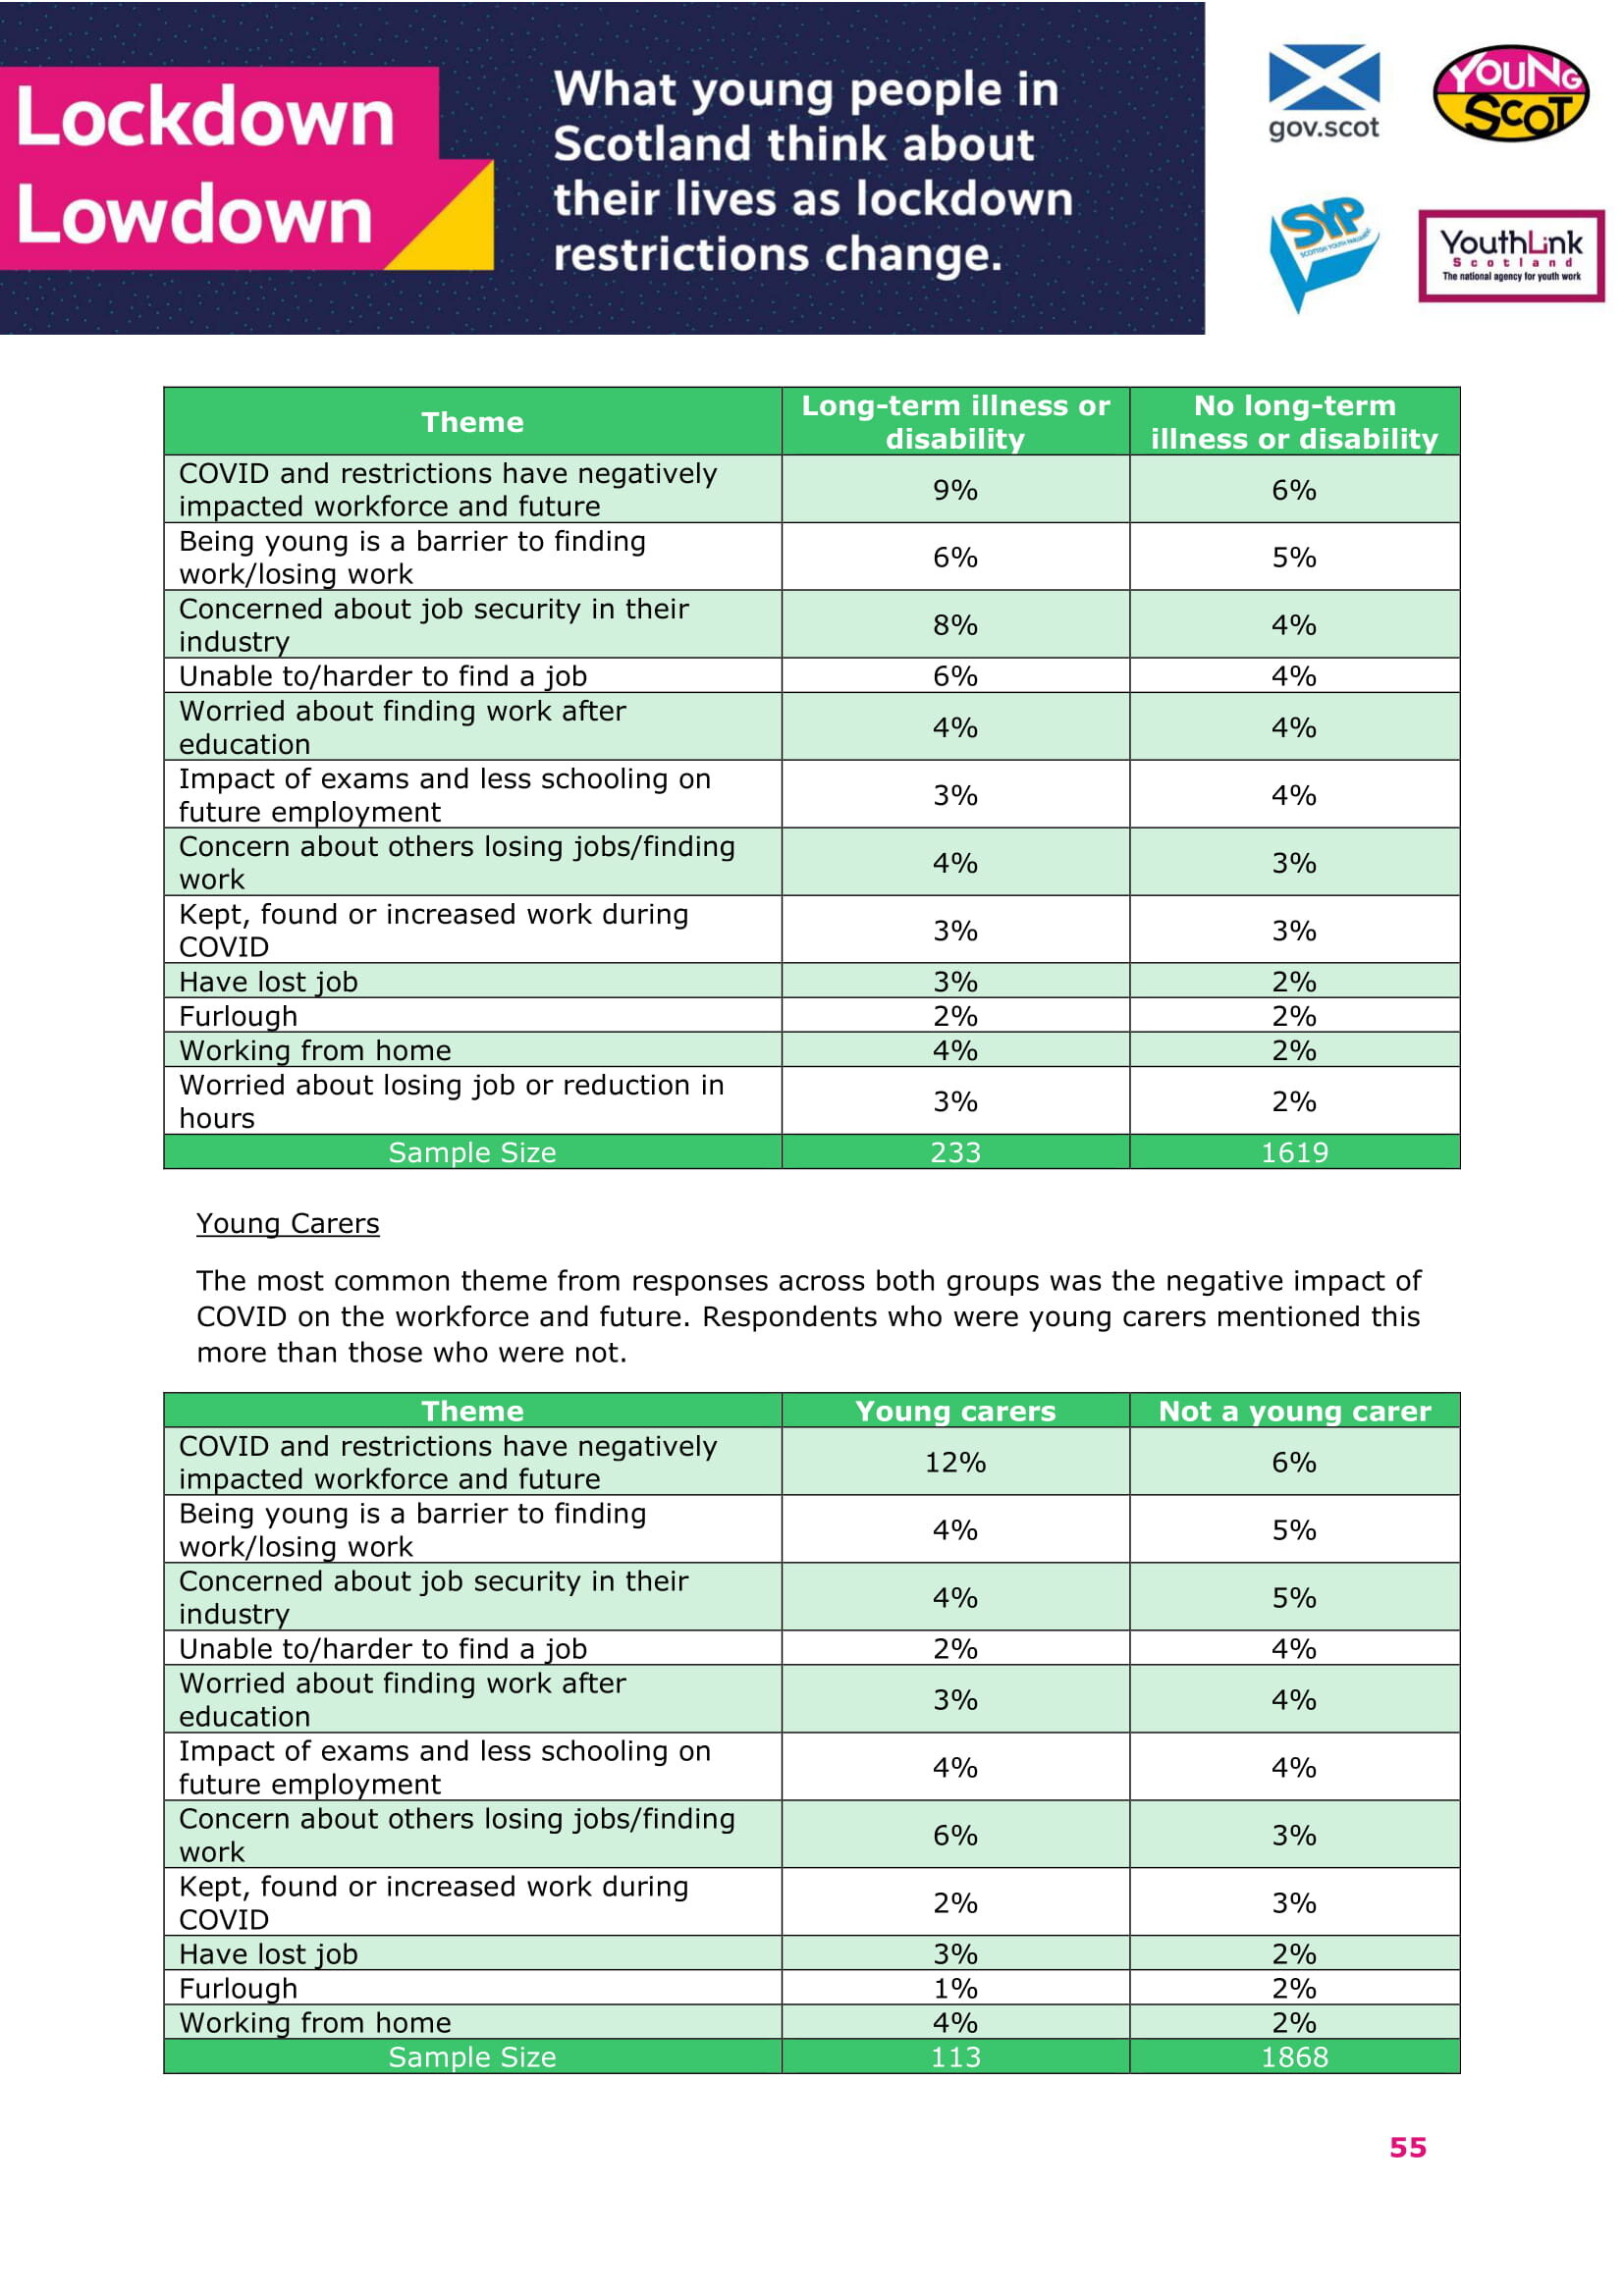
When asked for any further thoughts on employment, respondents who had a long-term illness or disability expressed concern about job security in their industry and the inability/difficulty to find a job slightly more than the other group.
Young carers were less likely to agree that they had a good relationship with their family than others (74% of respondents who were young carers compared with 84% who were not.
When asked if they were happy to be back to learning in person, BAME respondents were less likely to agree than White respondents.
The report details key findings by each demographic group, followed by a breakdown of each question by each group.
You can scroll through a preview of our report, download a full pdf version using the Download button or access a plain text version of our report below.


Plain Text Version
Introduction
In response to the COVID-19 pandemic, Scottish Youth Parliament, YouthLink Scotland and Young Scot partnered to find out how the pandemic was impacting young people in Scotland.
#LockdownLowdown: Survey 1
In April, the first #LockdownLowdown national survey received around 2,500 responses from young people aged 11 to 26 from across Scotland. The results were shared with stakeholders who recognised the importance of hearing young people's voices during this time. More information about the survey can be accessed here.
#LockdownLowdown: Survey 2
In recognition that the impact of lockdown will be long-term, the Scottish Government commissioned a follow-on #LockdownLowdown survey that ran between 28th September and 2nd November 2020 and received 6,043 responses.
This report explores the findings of this second survey – with a focus on the concerns of young people as lockdown restrictions change.
This activity ran alongside focus groups held by the Scottish Youth Parliament with young people whose voices are seldom heard.
This report is an accompaniment to the main report, released in November 2020. It details the main issues that arose in the survey for eight different demographic groups. The report then explores each question in turn for each group.
Demographic Groups
• SIMD Quintile
• Age Group
• Gender Identity
• Long-term Illness or Disability
• Young Carers
• Care Experienced Young People
• Ethnic Group
• Level of Education
• Employment Status
Notes
1. For the purposes of easier comparison, questions that were asked on a five-point agreement scale have been reduced to a three-point agreement scale. This is demonstrated in the table headings of the relevant questions.
2. There are several qualitative questions within this report. For each of these questions, the main response themes were listed, and each demographic was then compared. The most common theme(s) for each demographic group have been highlighted in the accompanying table. All qualitative questions were optional so the proportion of responses may differ between questions and between demographics (see note below). Response levels to each qualitative question received between 1,000 and 2,000 responses, representing between a quarter and a third of total respondents.
3. Several of the demographic questions were optional. For the purposes of this report, the data only represents responses from those that we have information from only.
4. All data has been reported in percentages to aid comparison between groups. In some cases, the response rate from a particular group may have been too low to calculate a percentage. This group will then have been excluded from comparison. This is noted in the report where relevant.
The following few pages explores the main differences noted for each demographic group. Where results to questions were similar across demographics they have not been noted.
Key Findings: SIMD Quintile
A large number of respondents (4,818) voluntarily provided their postcode. These postcodes were freely typed and 4,384 were able to be mapped against the SIMD20 Quintile data.
SIMD Quintile Respondents
1 534
2 711
3 855
4 1,031
5 1,253
Respondents from the most disadvantaged SIMD areas (SIMD1) were underrepresented, while those in the least disadvantaged areas (SIMD5) were overrepresented. Respondent numbers are given in the table below.
Impact of coronavirus on education
• When asked if they were happy to be back to learning in person, respondents in less deprived areas agreed with this statement more than those in other Quintiles (71% of respondents in Quintile 4 and 70% of respondents in Quintile 5 compared with 56% of respondents in Quintile 1).
• When asked if their educational establishment had re-opened in a safe way, respondents in less deprived areas agreed with this statement more than those in other Quintiles (66% of respondents in Quintile 4 and 68% of respondents in Quintile 5 compared with 57% in Quintile 1).
Impact of coronavirus on relationships
• In terms of relationships, there were no major differences between SIMD Quintiles.
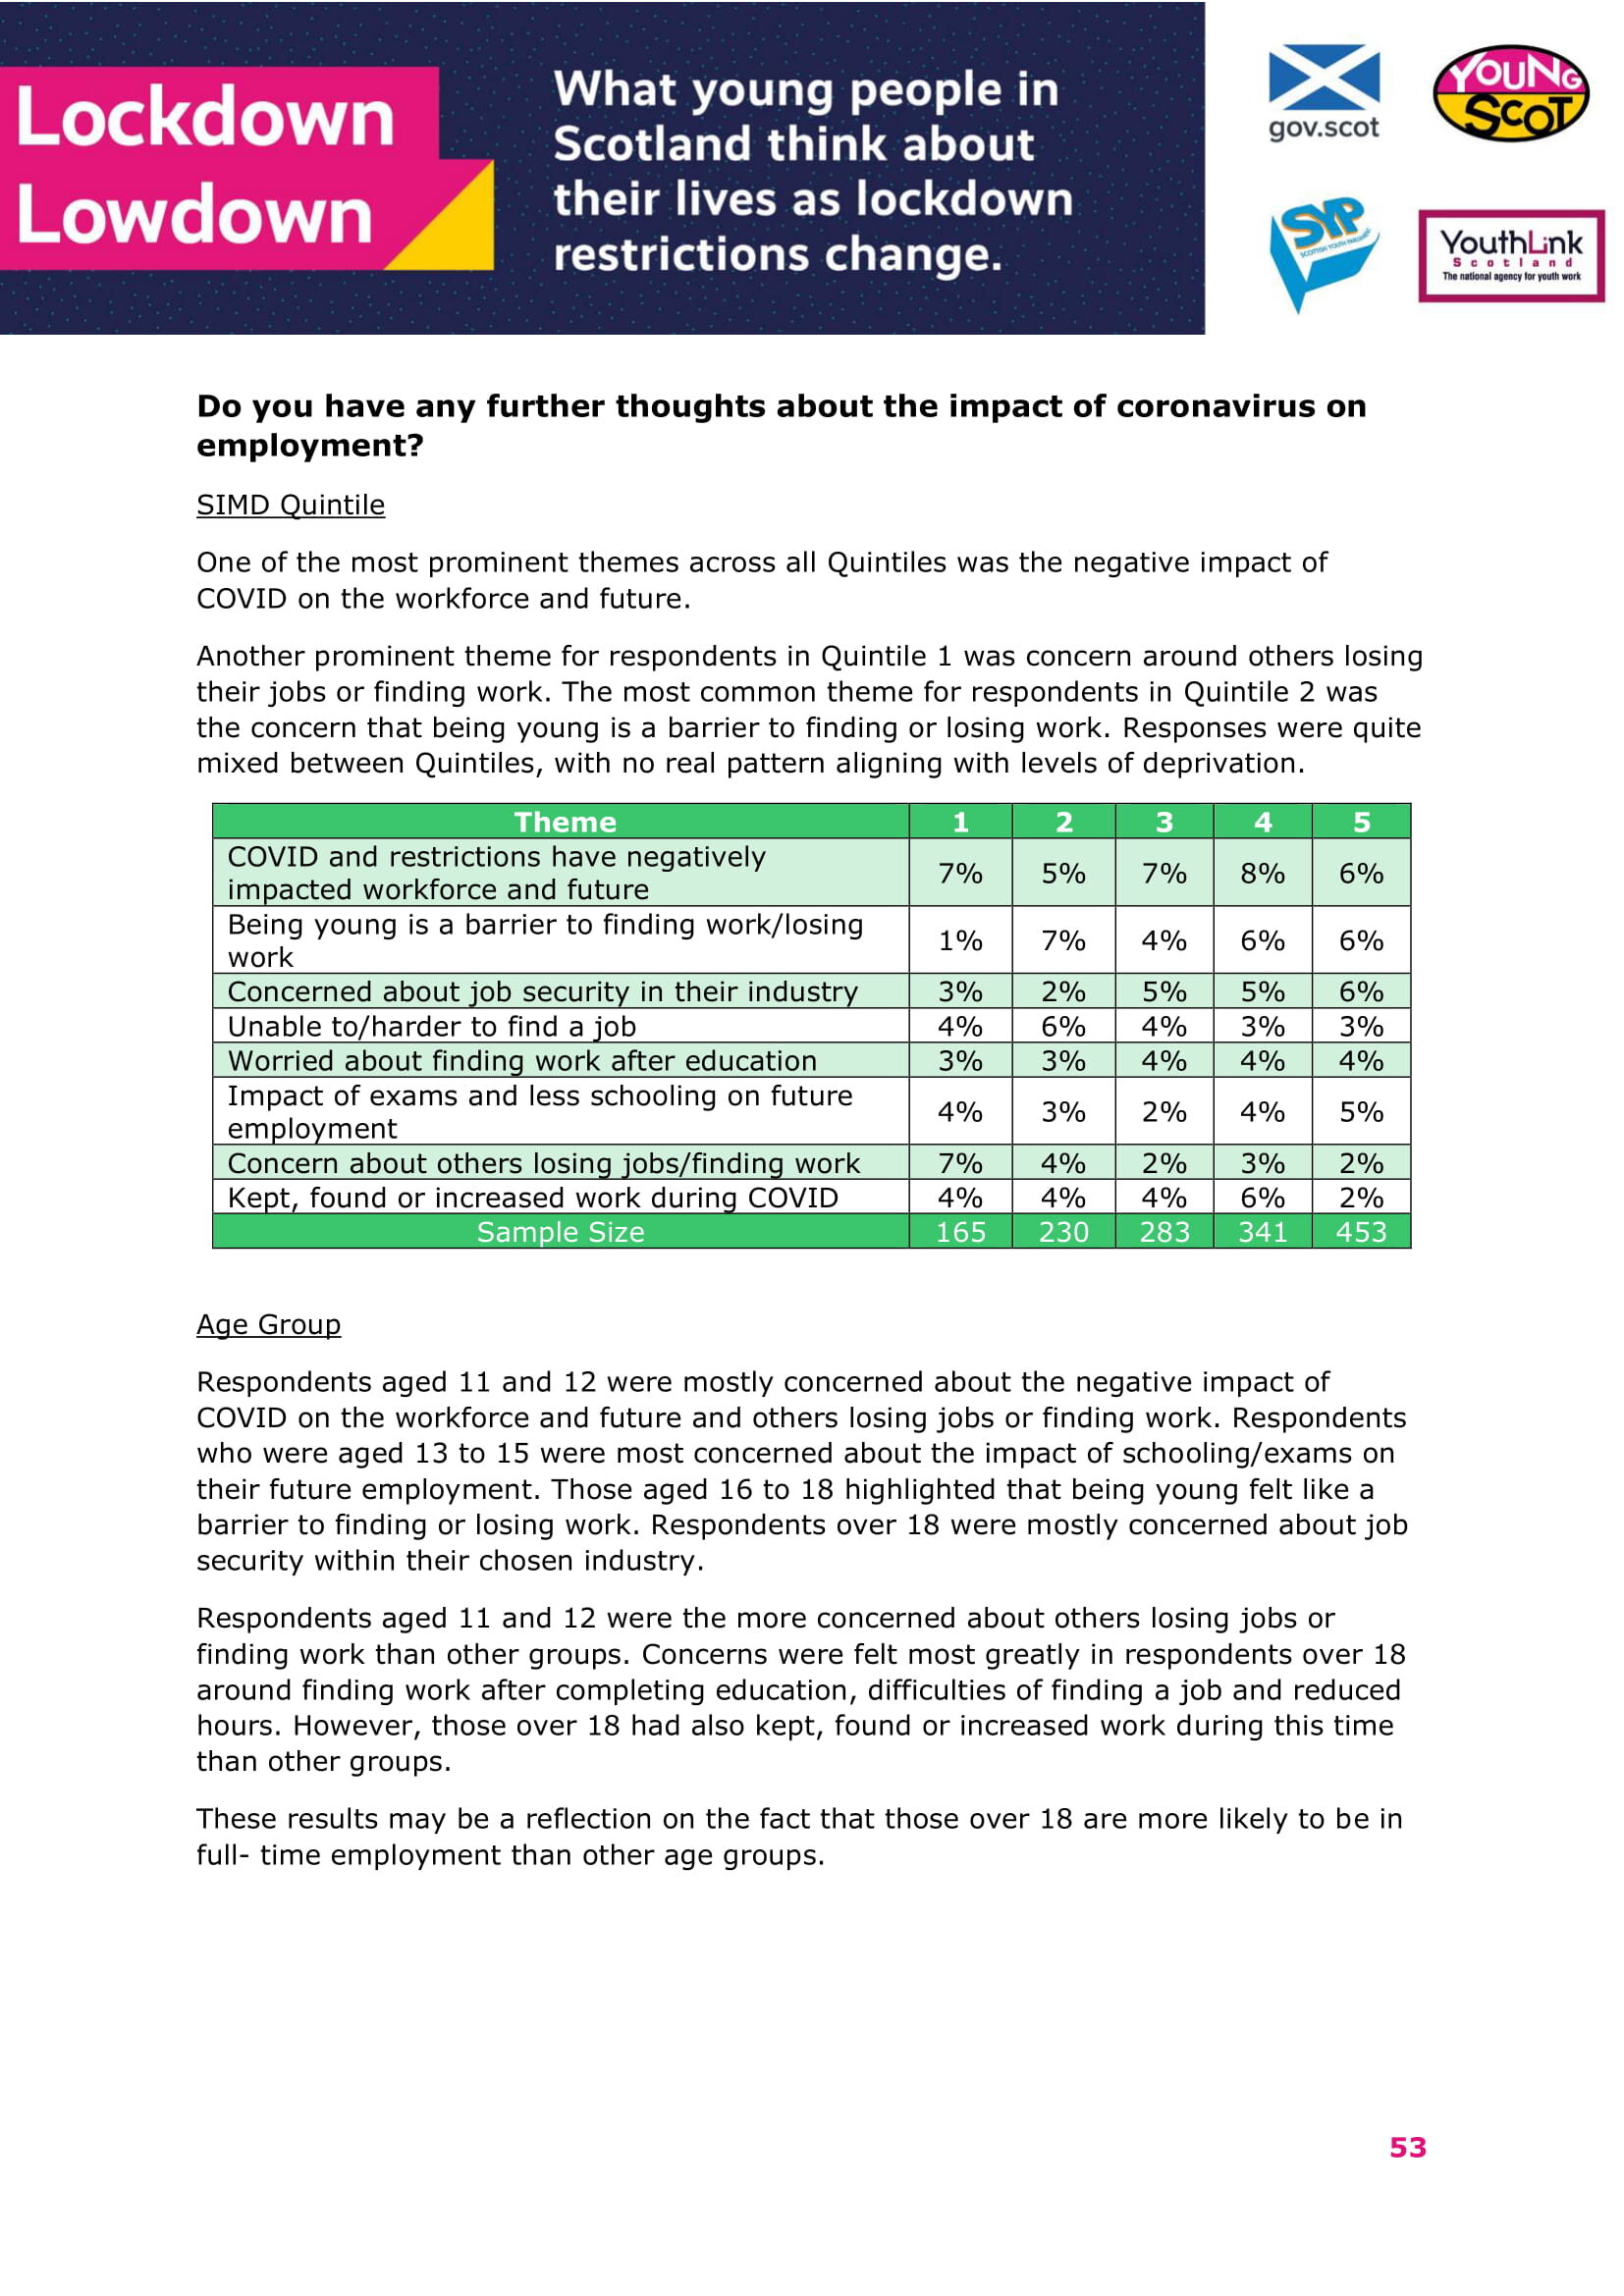
Impact of coronavirus on employment
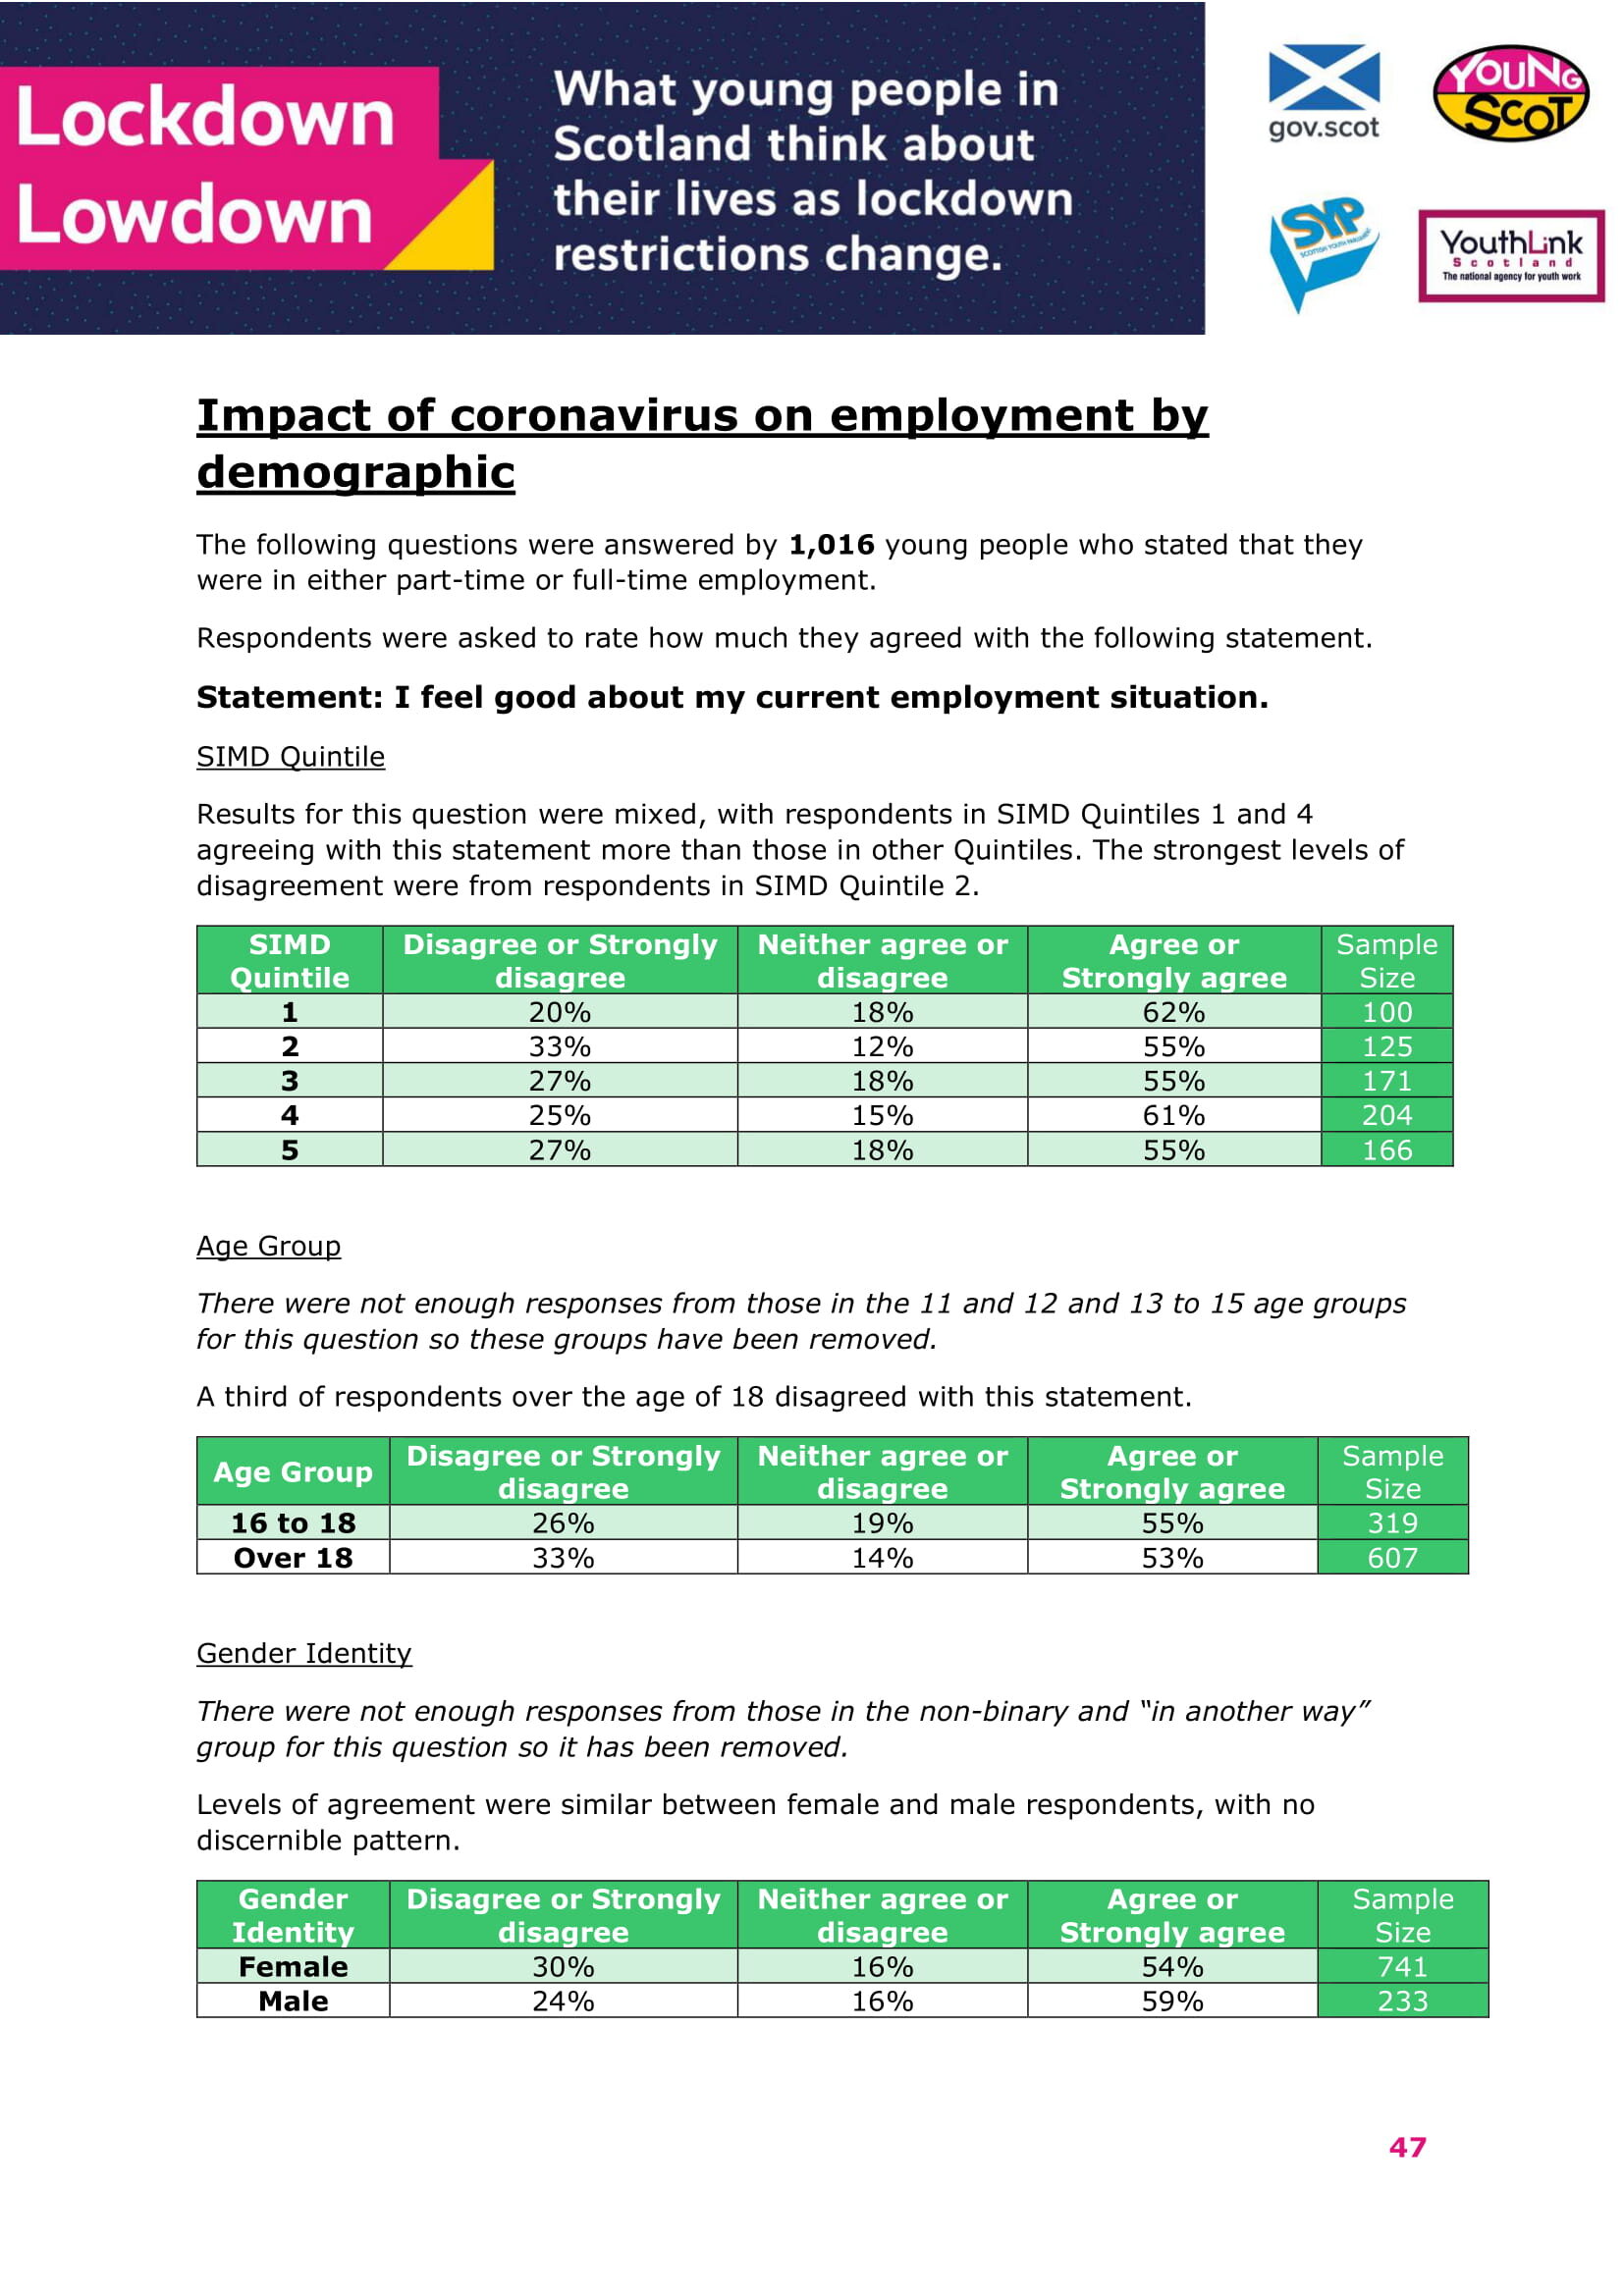
• Respondents in SIMD Quintiles 1 and 4 agreed that they felt good about their current employment situation more than those in other Quintiles (62% in Quintile 1 and 61% in Quintile 4 compared with 55% in all other Quintiles).
• When asked for any further thoughts on employment, responses were mixed between the Quintiles, but with no clear pattern aligning with levels of deprivation. This was a qualitative question with fewer responses compared to others.
Impact of coronavirus generally (including mental and physical health)
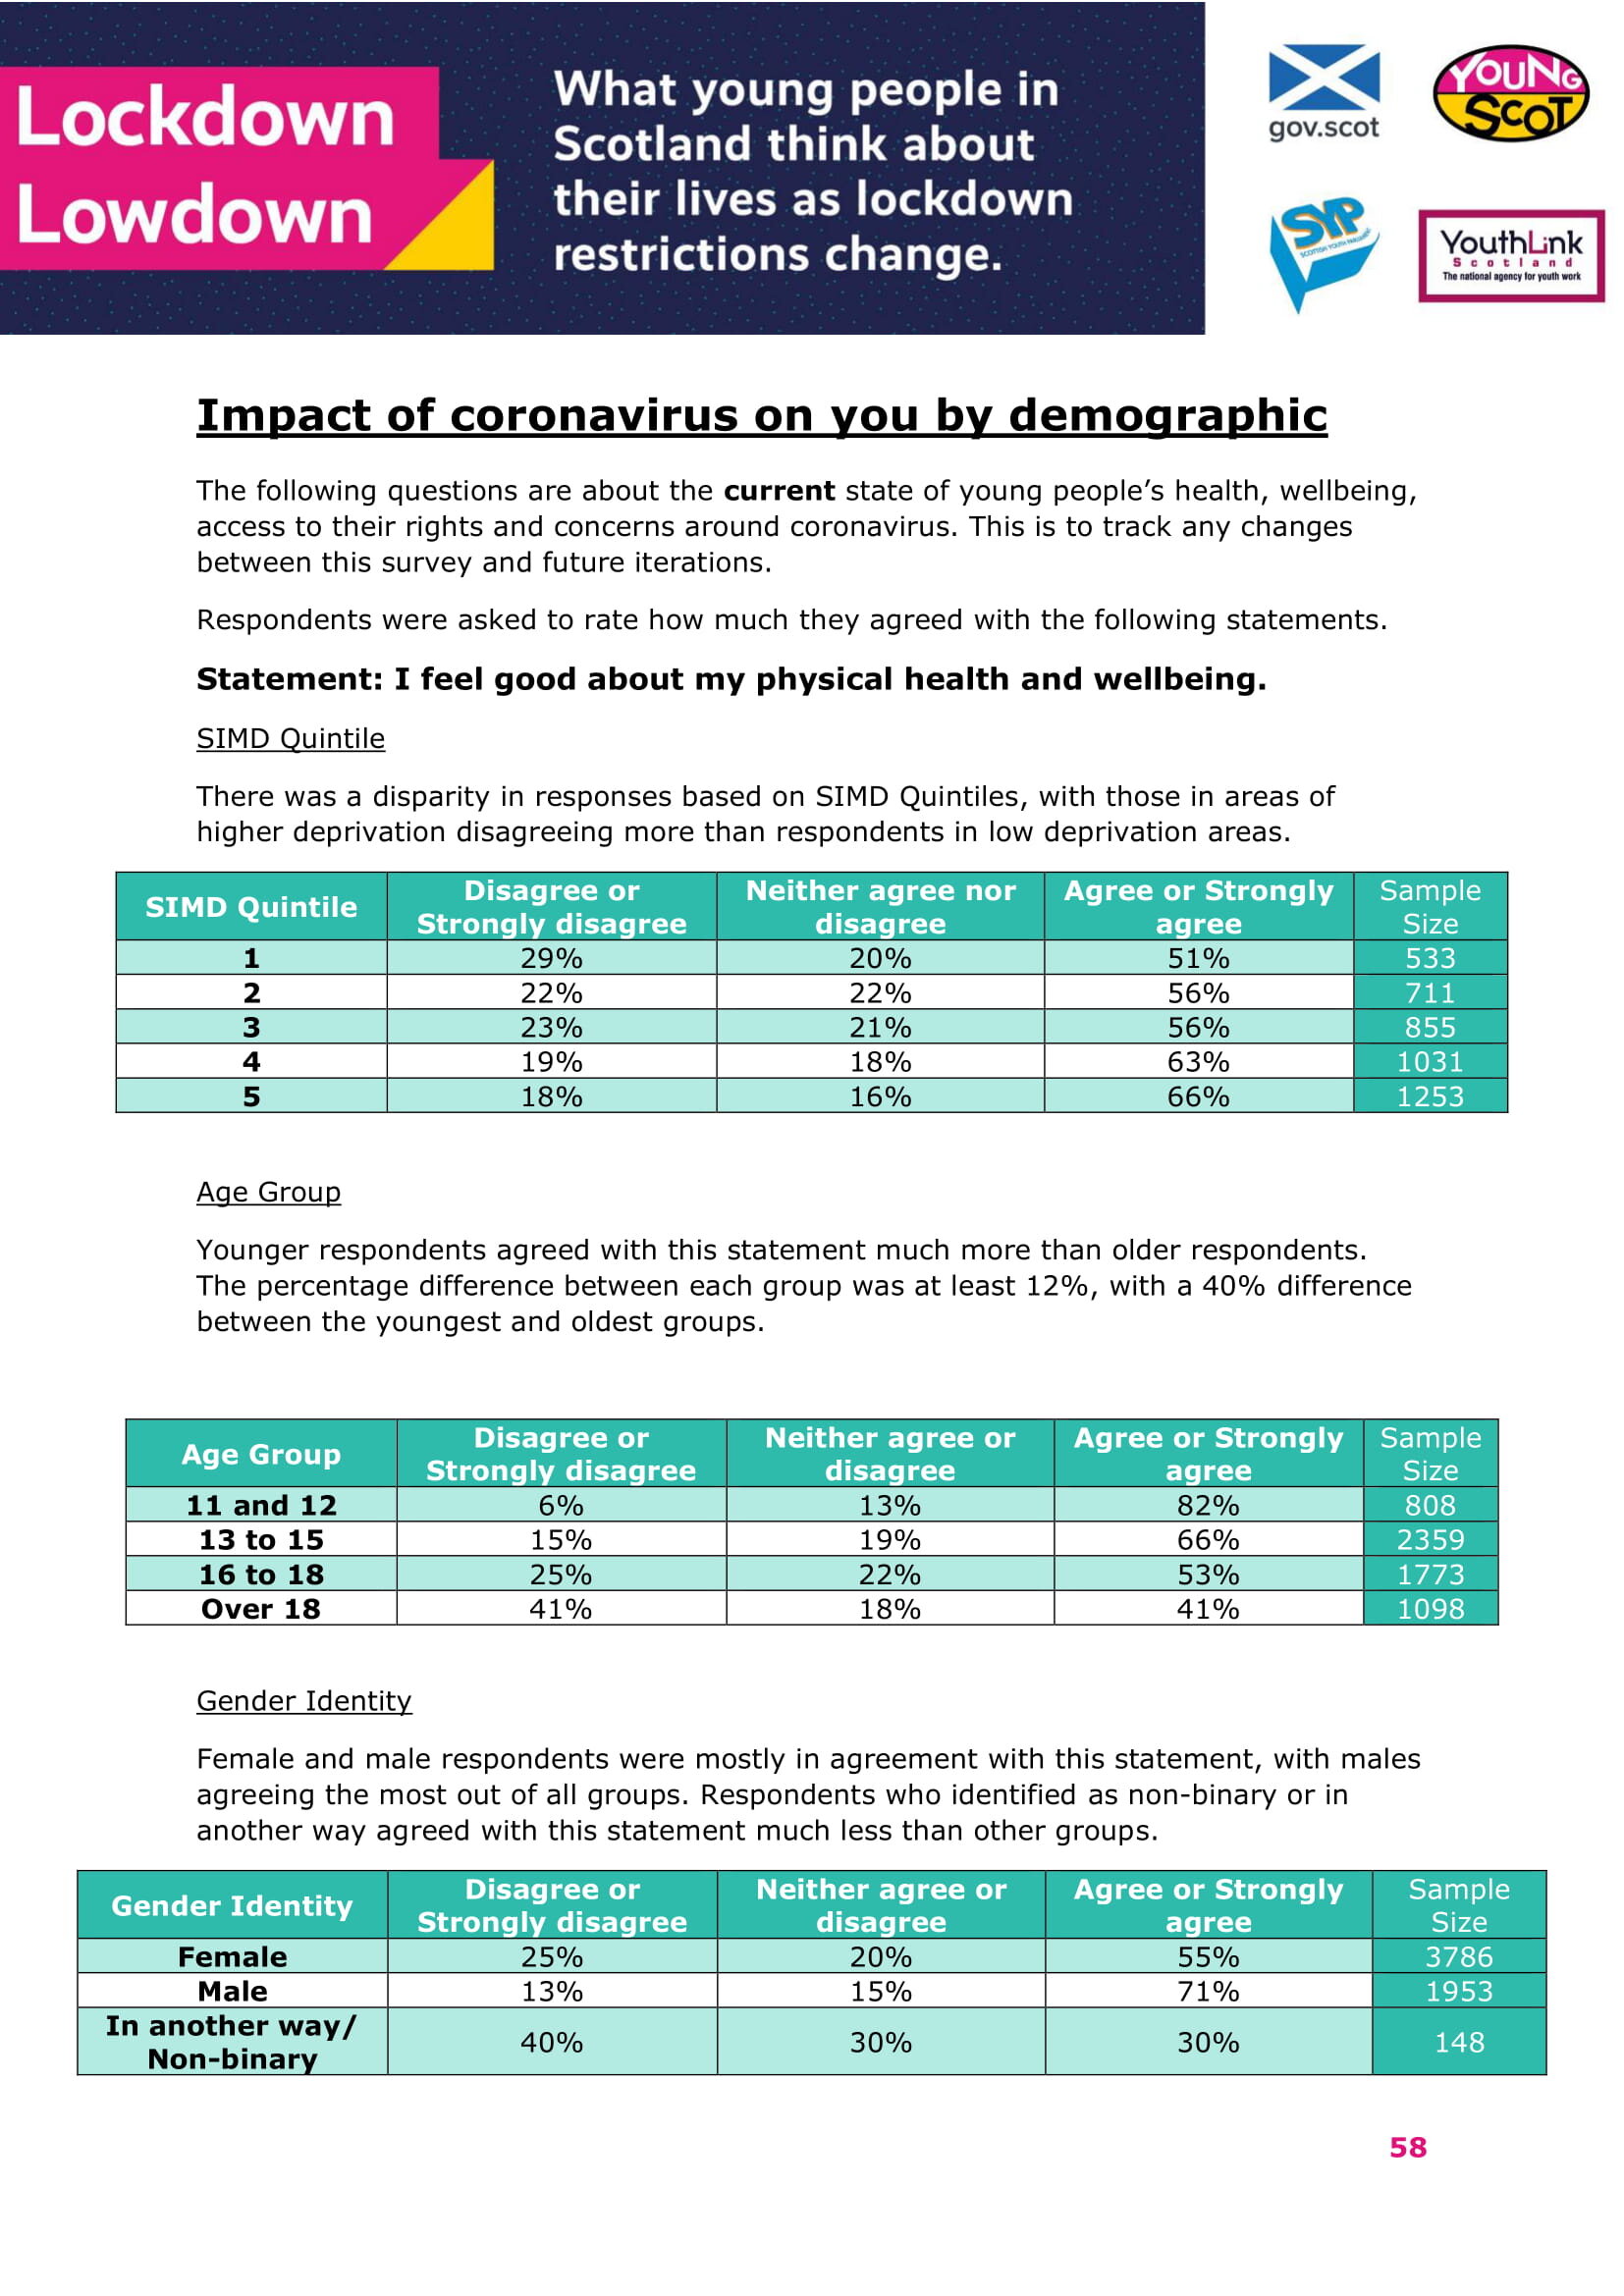
• Respondents in levels of the most deprived areas were less likely to say they felt good about their physical health and wellbeing than respondents in areas of lower deprivation (66% of respondents in Quintile 5 and 63% in Quintile 4 compared with around 51% of respondents in Quintile 1).
• In terms of mental health and wellbeing, responses were mixed, but with no clear pattern aligning with levels of deprivation.
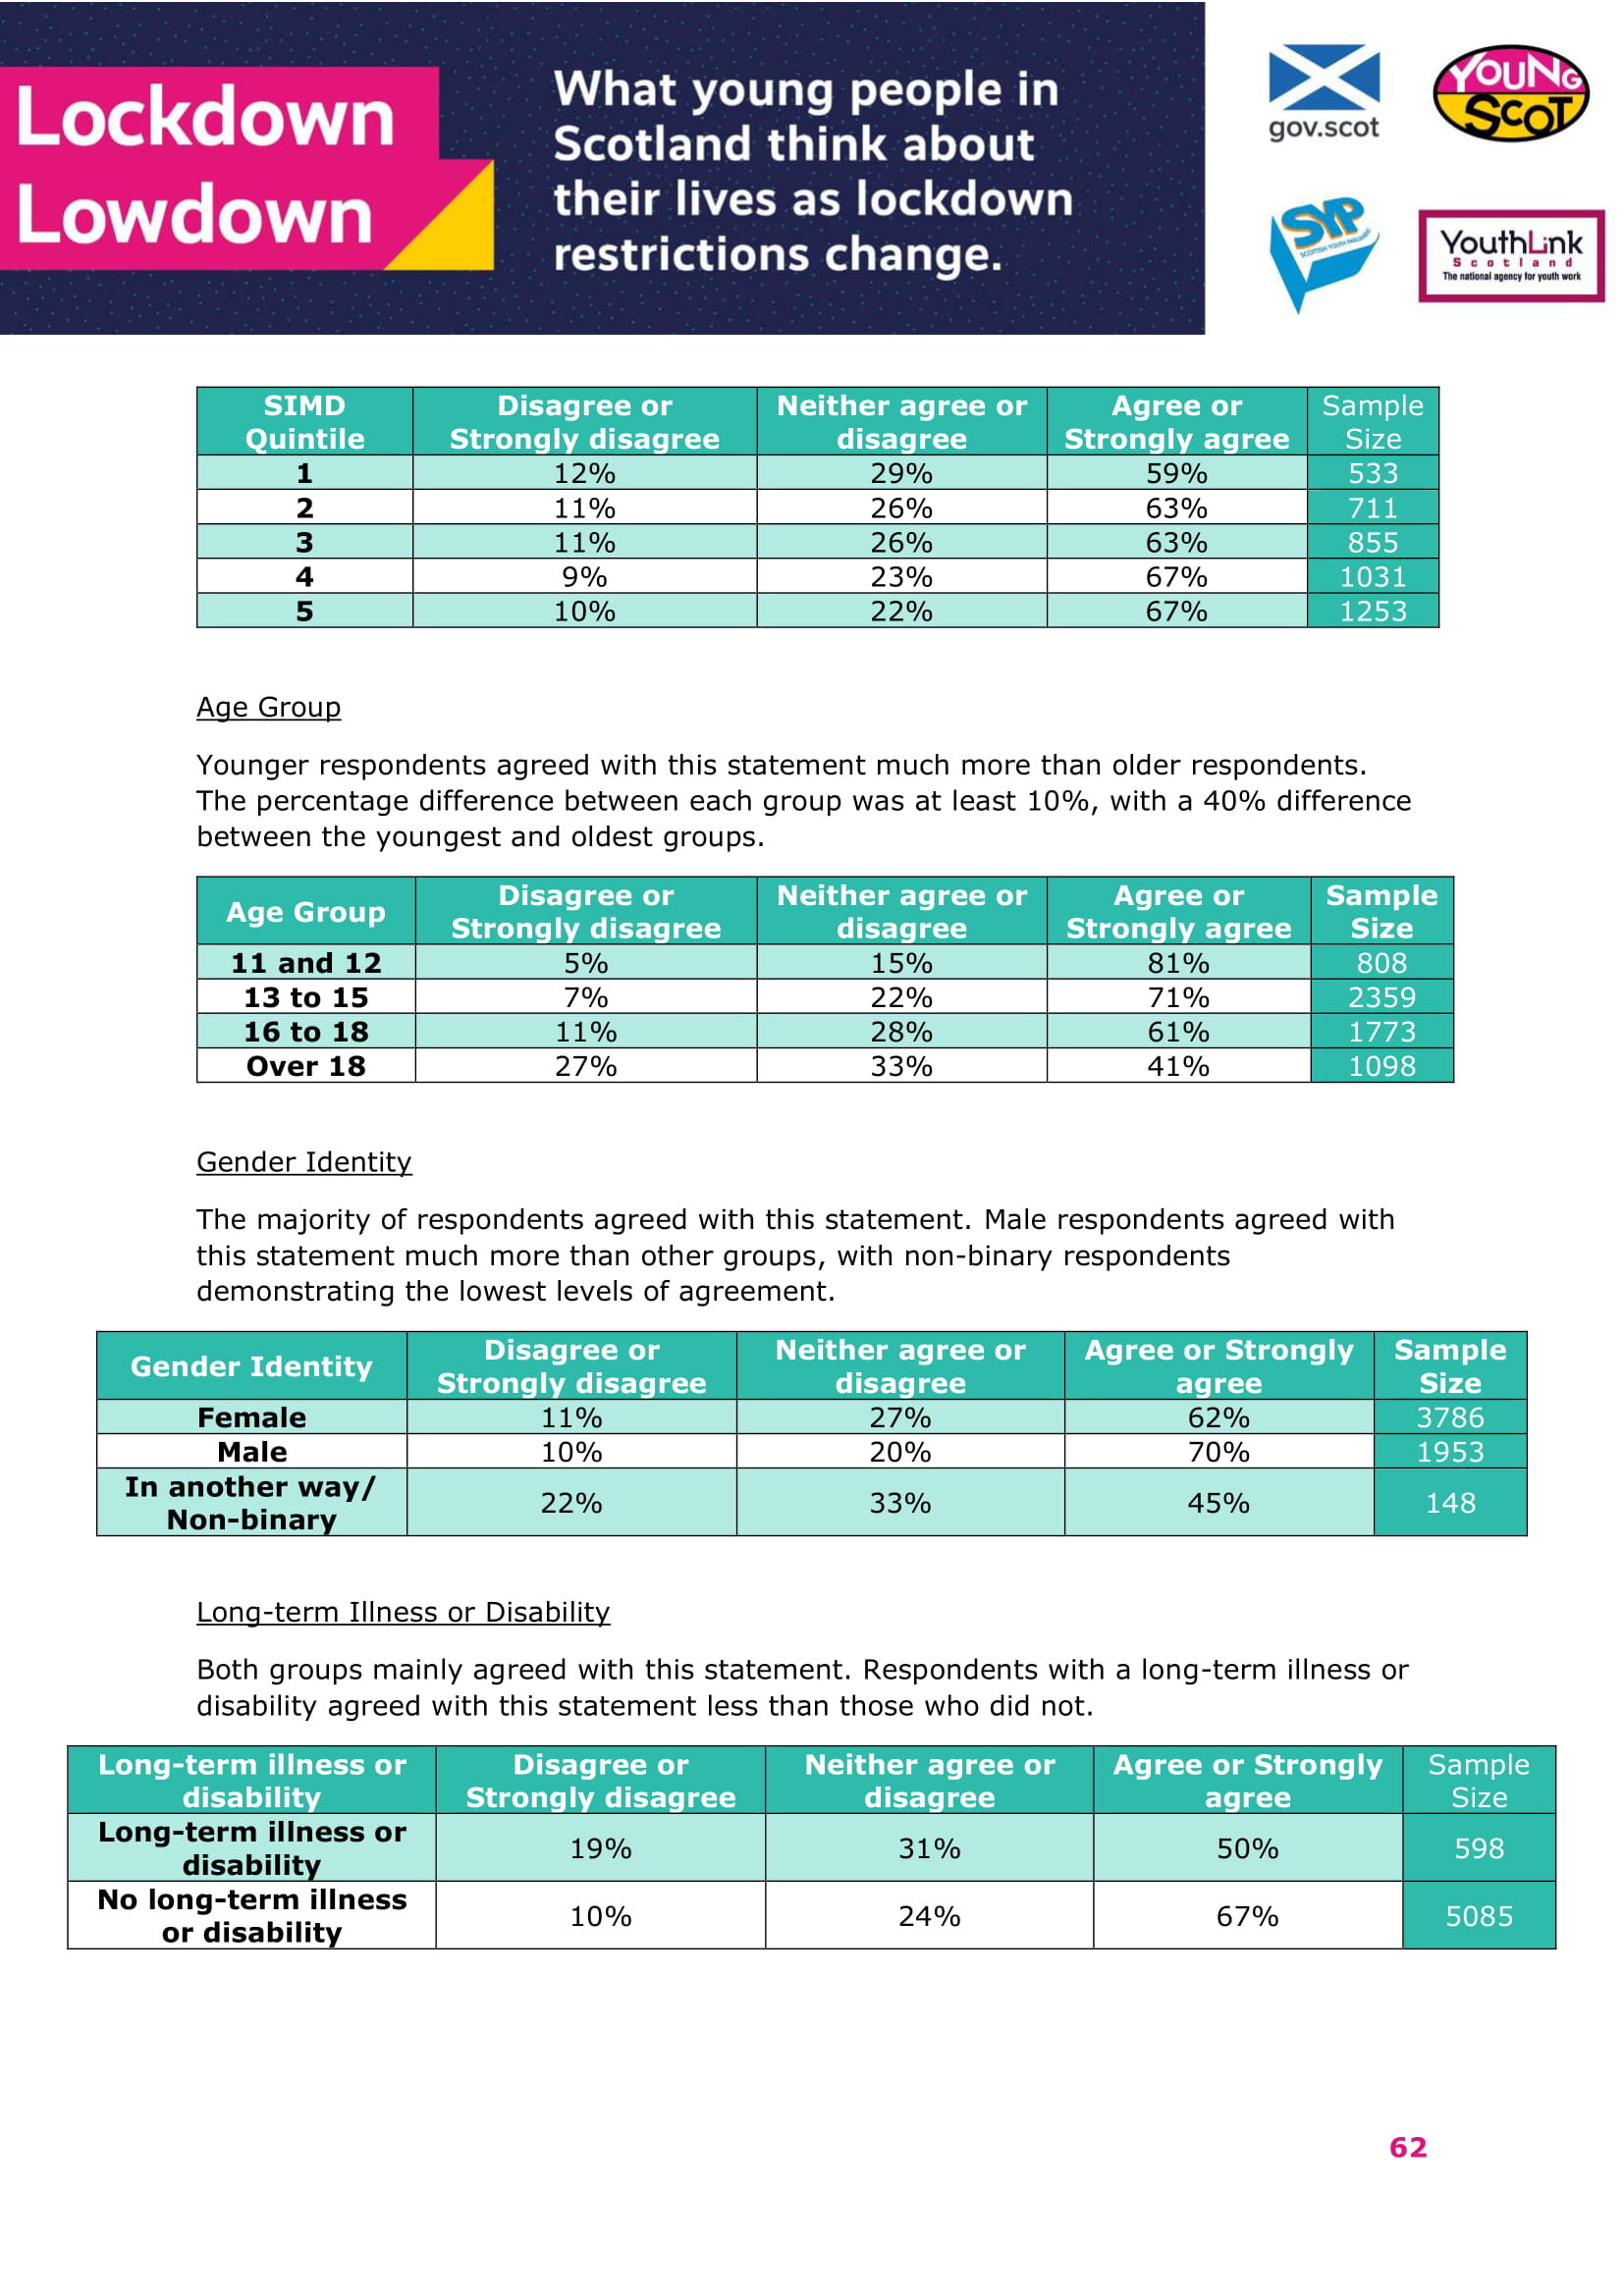
• When asked if they felt able to access their rights as a young person, respondents in the most deprived areas were less likely to agree than respondents in other Quintiles (59% in SIMD Quintile 1 compared with 63% in Quintiles 2 and 3 and 67% in Quintiles 4 and 5).
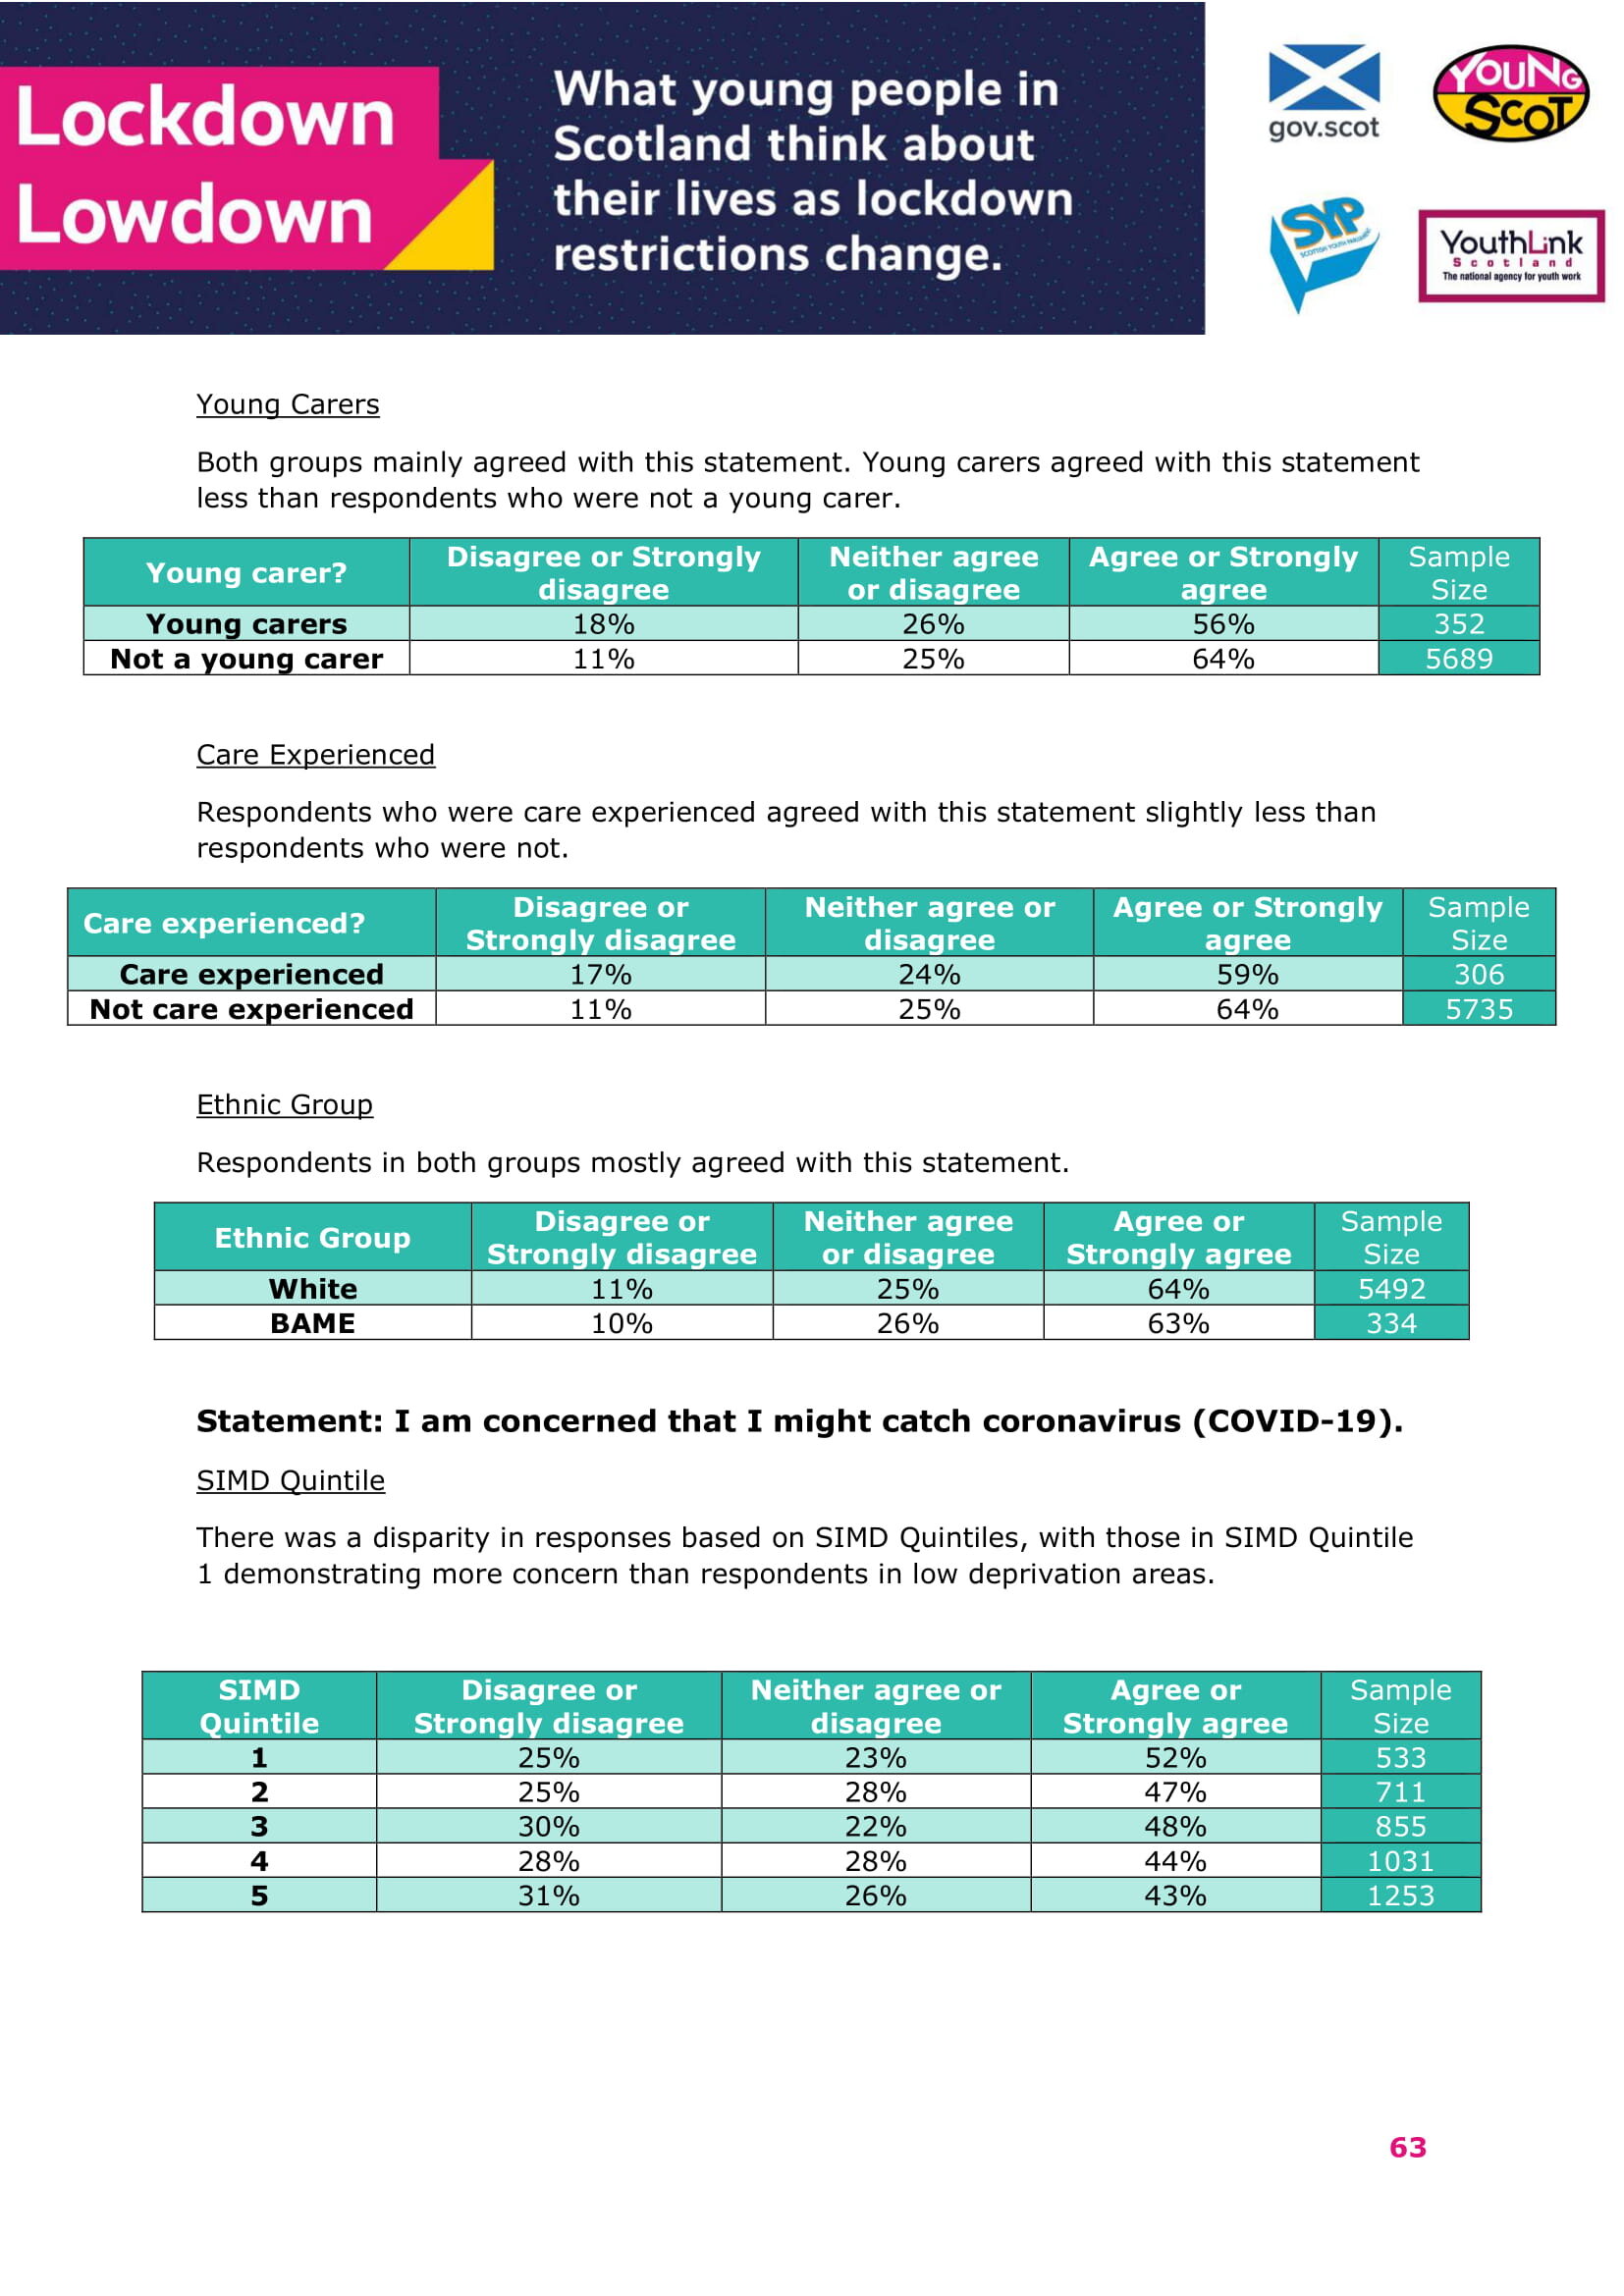
• Respondents in the most deprived areas demonstrated more concern over catching coronavirus (COVID-19) than respondents in low deprivation areas (52% of respondents in Quintile 1 compared with 43% in Quintile 5 and 44% in Quintile 4).
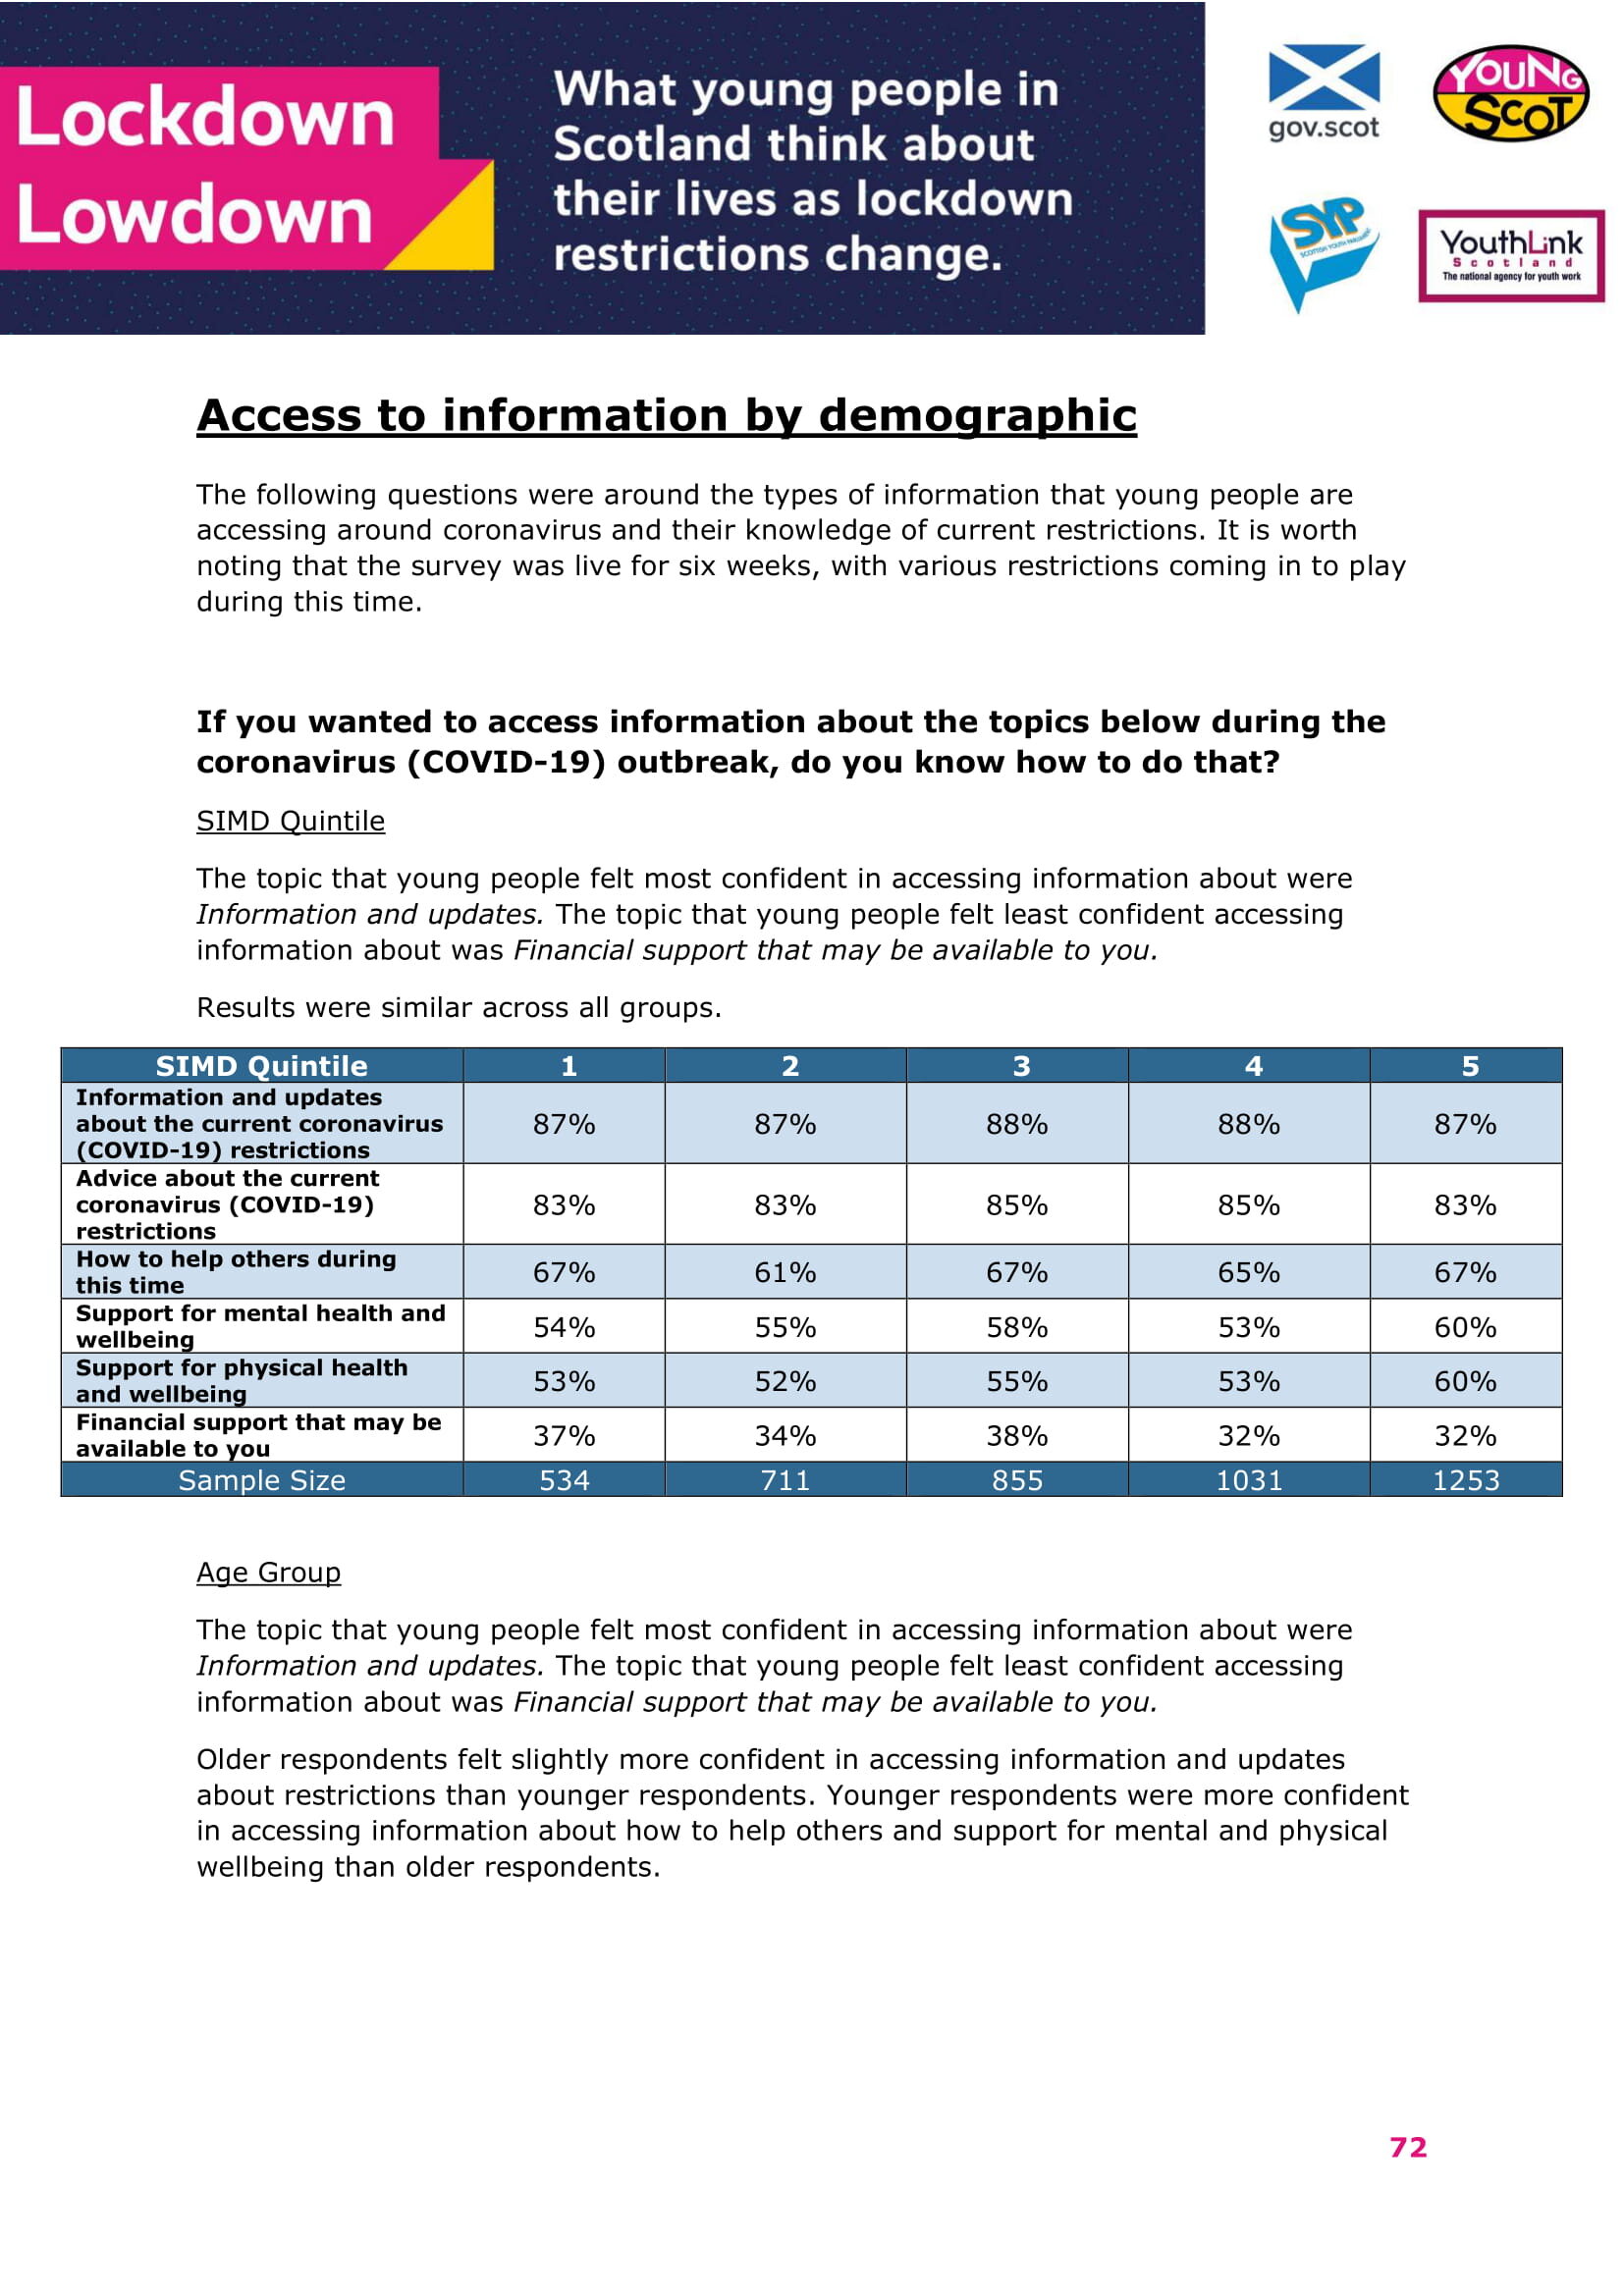
Access to information
• When asked if there were any topics that respondents wanted more information on, there was no clear pattern in responses aligning with levels of deprivation. This was a qualitative question with fewer responses compared to others.
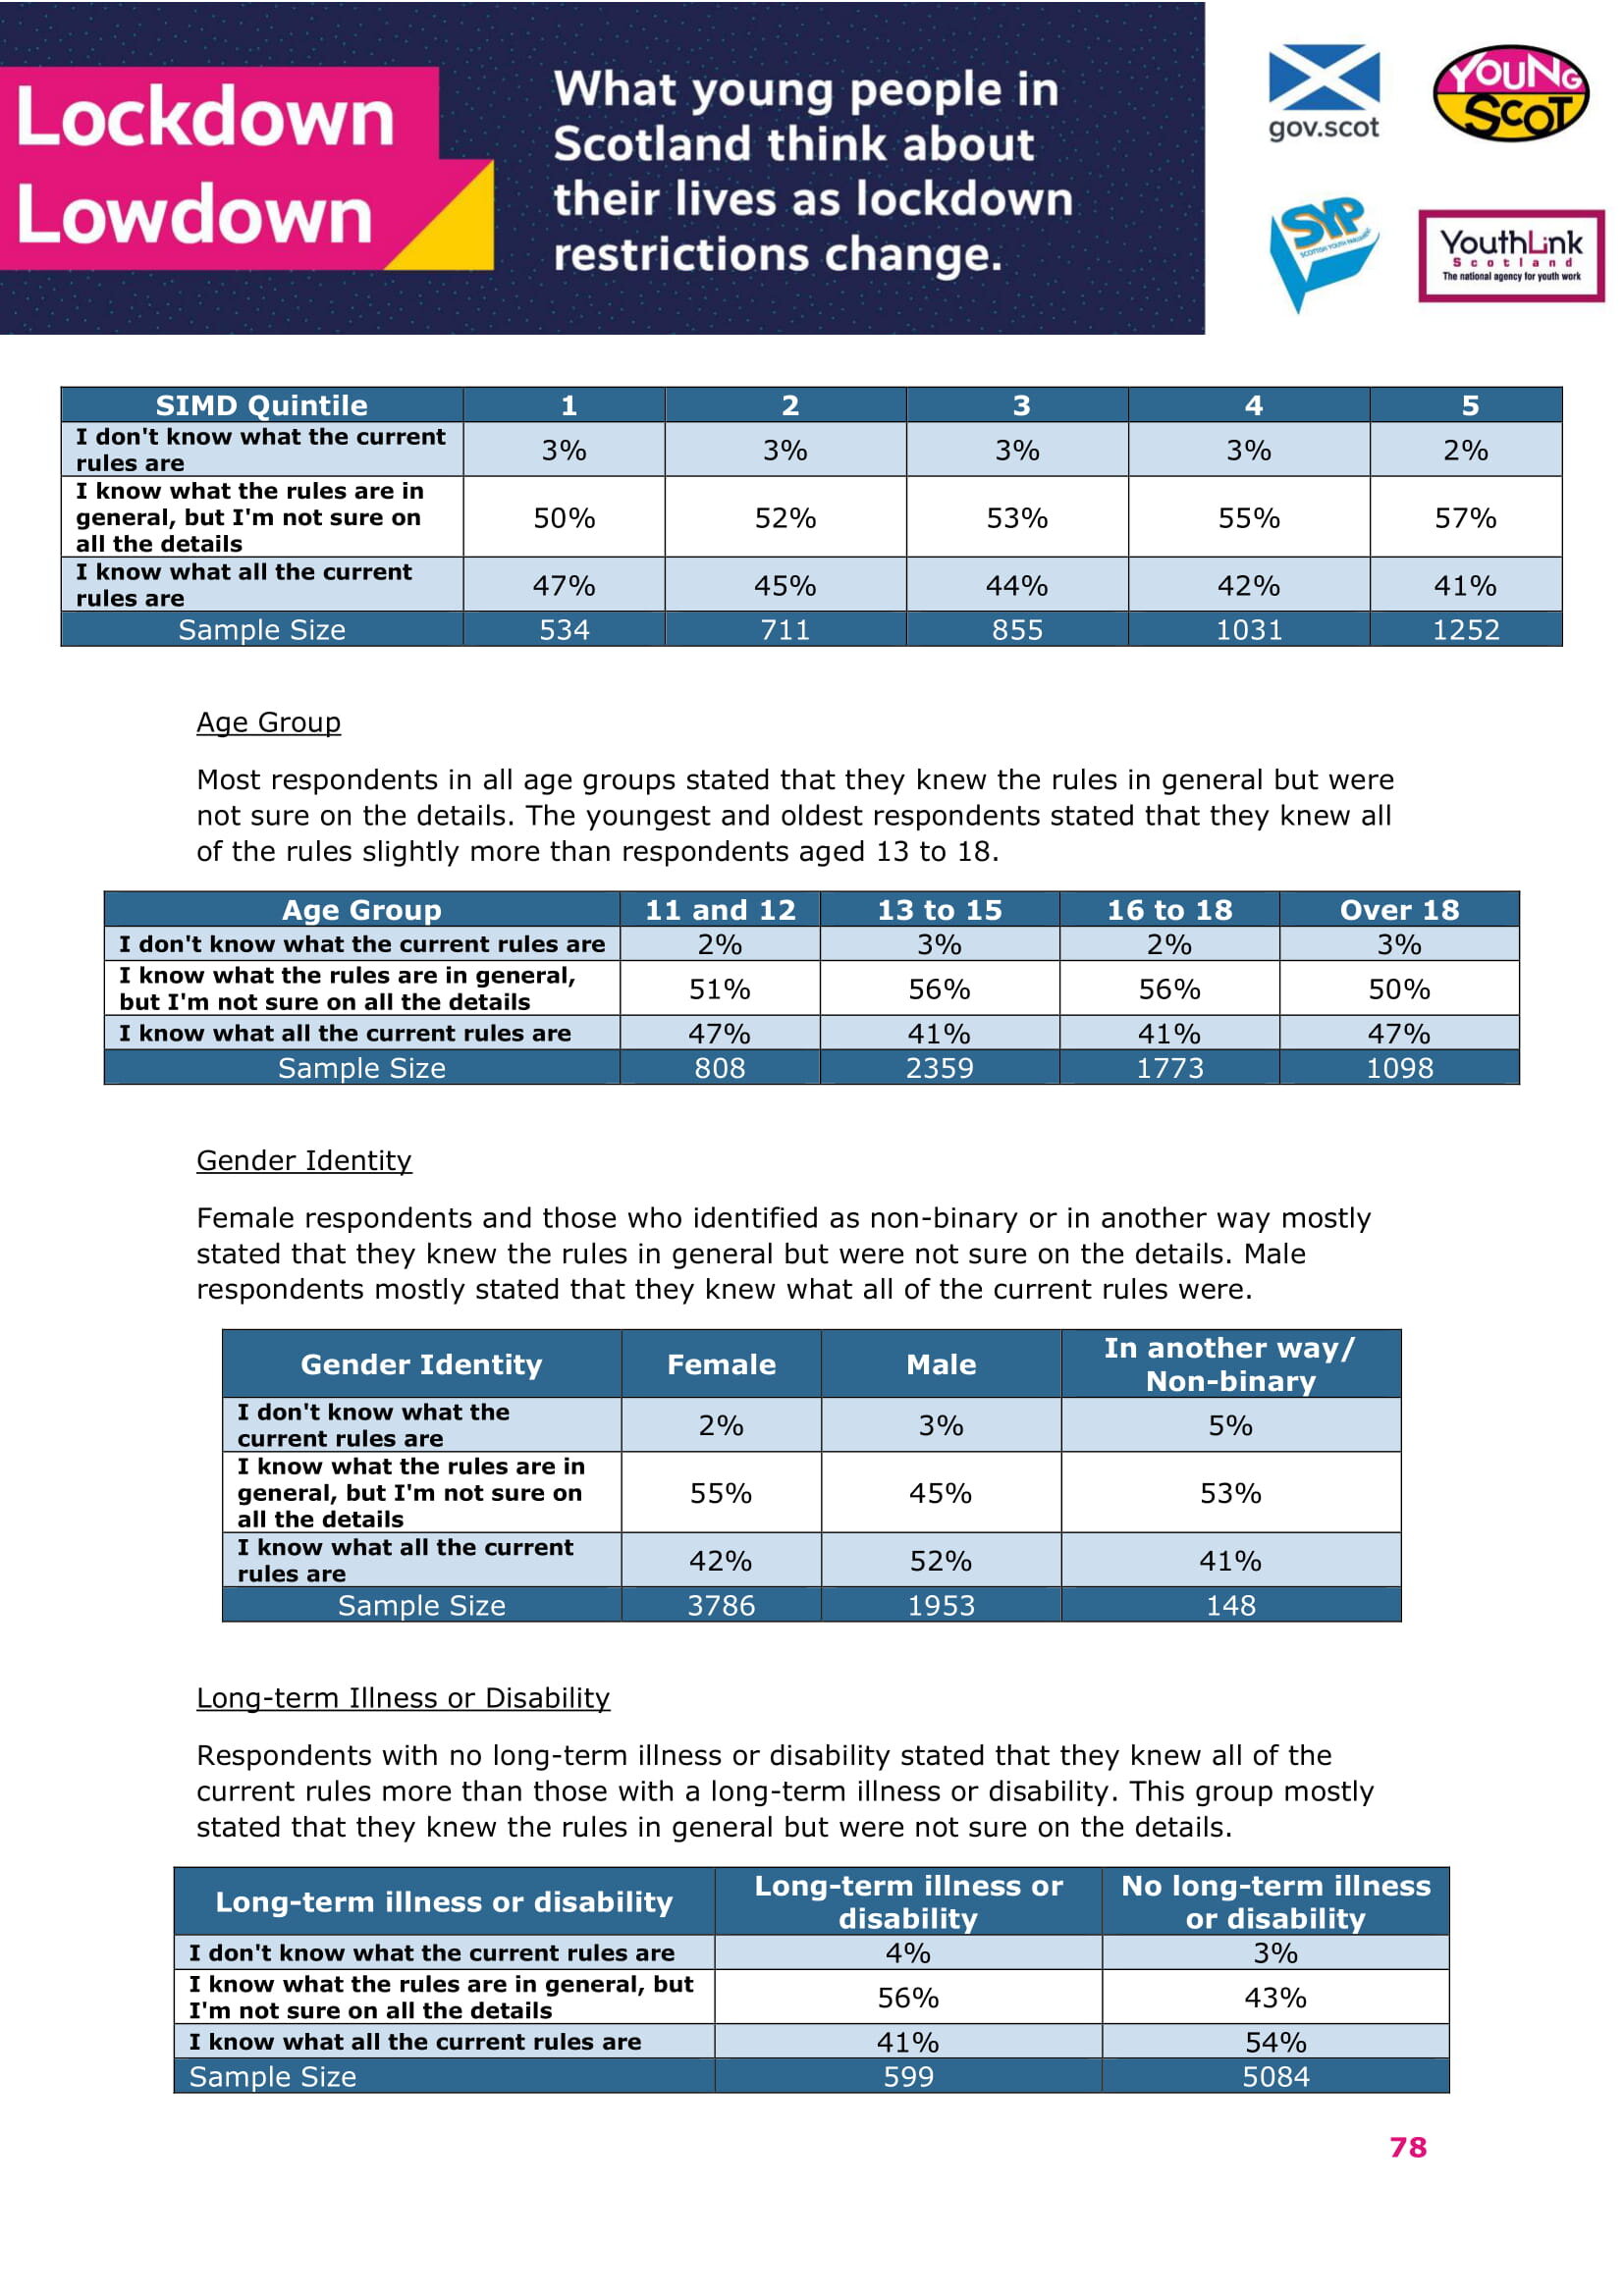
• Respondents in higher areas of deprivation were slightly more likely to say that they knew all of the rules than respondents in lower areas of deprivation (47% in Quintile 1 compared with 41% in Quintile 5).
• The majority of all groups stated that they had access to a personal device that could connect online. Respondents in areas of higher deprivation stated that they were slightly less likely to have access compared with other groups (96% of respondents in Quintiles 1 and 2 compared with 98% of respondents in Quintiles 4 and 5).
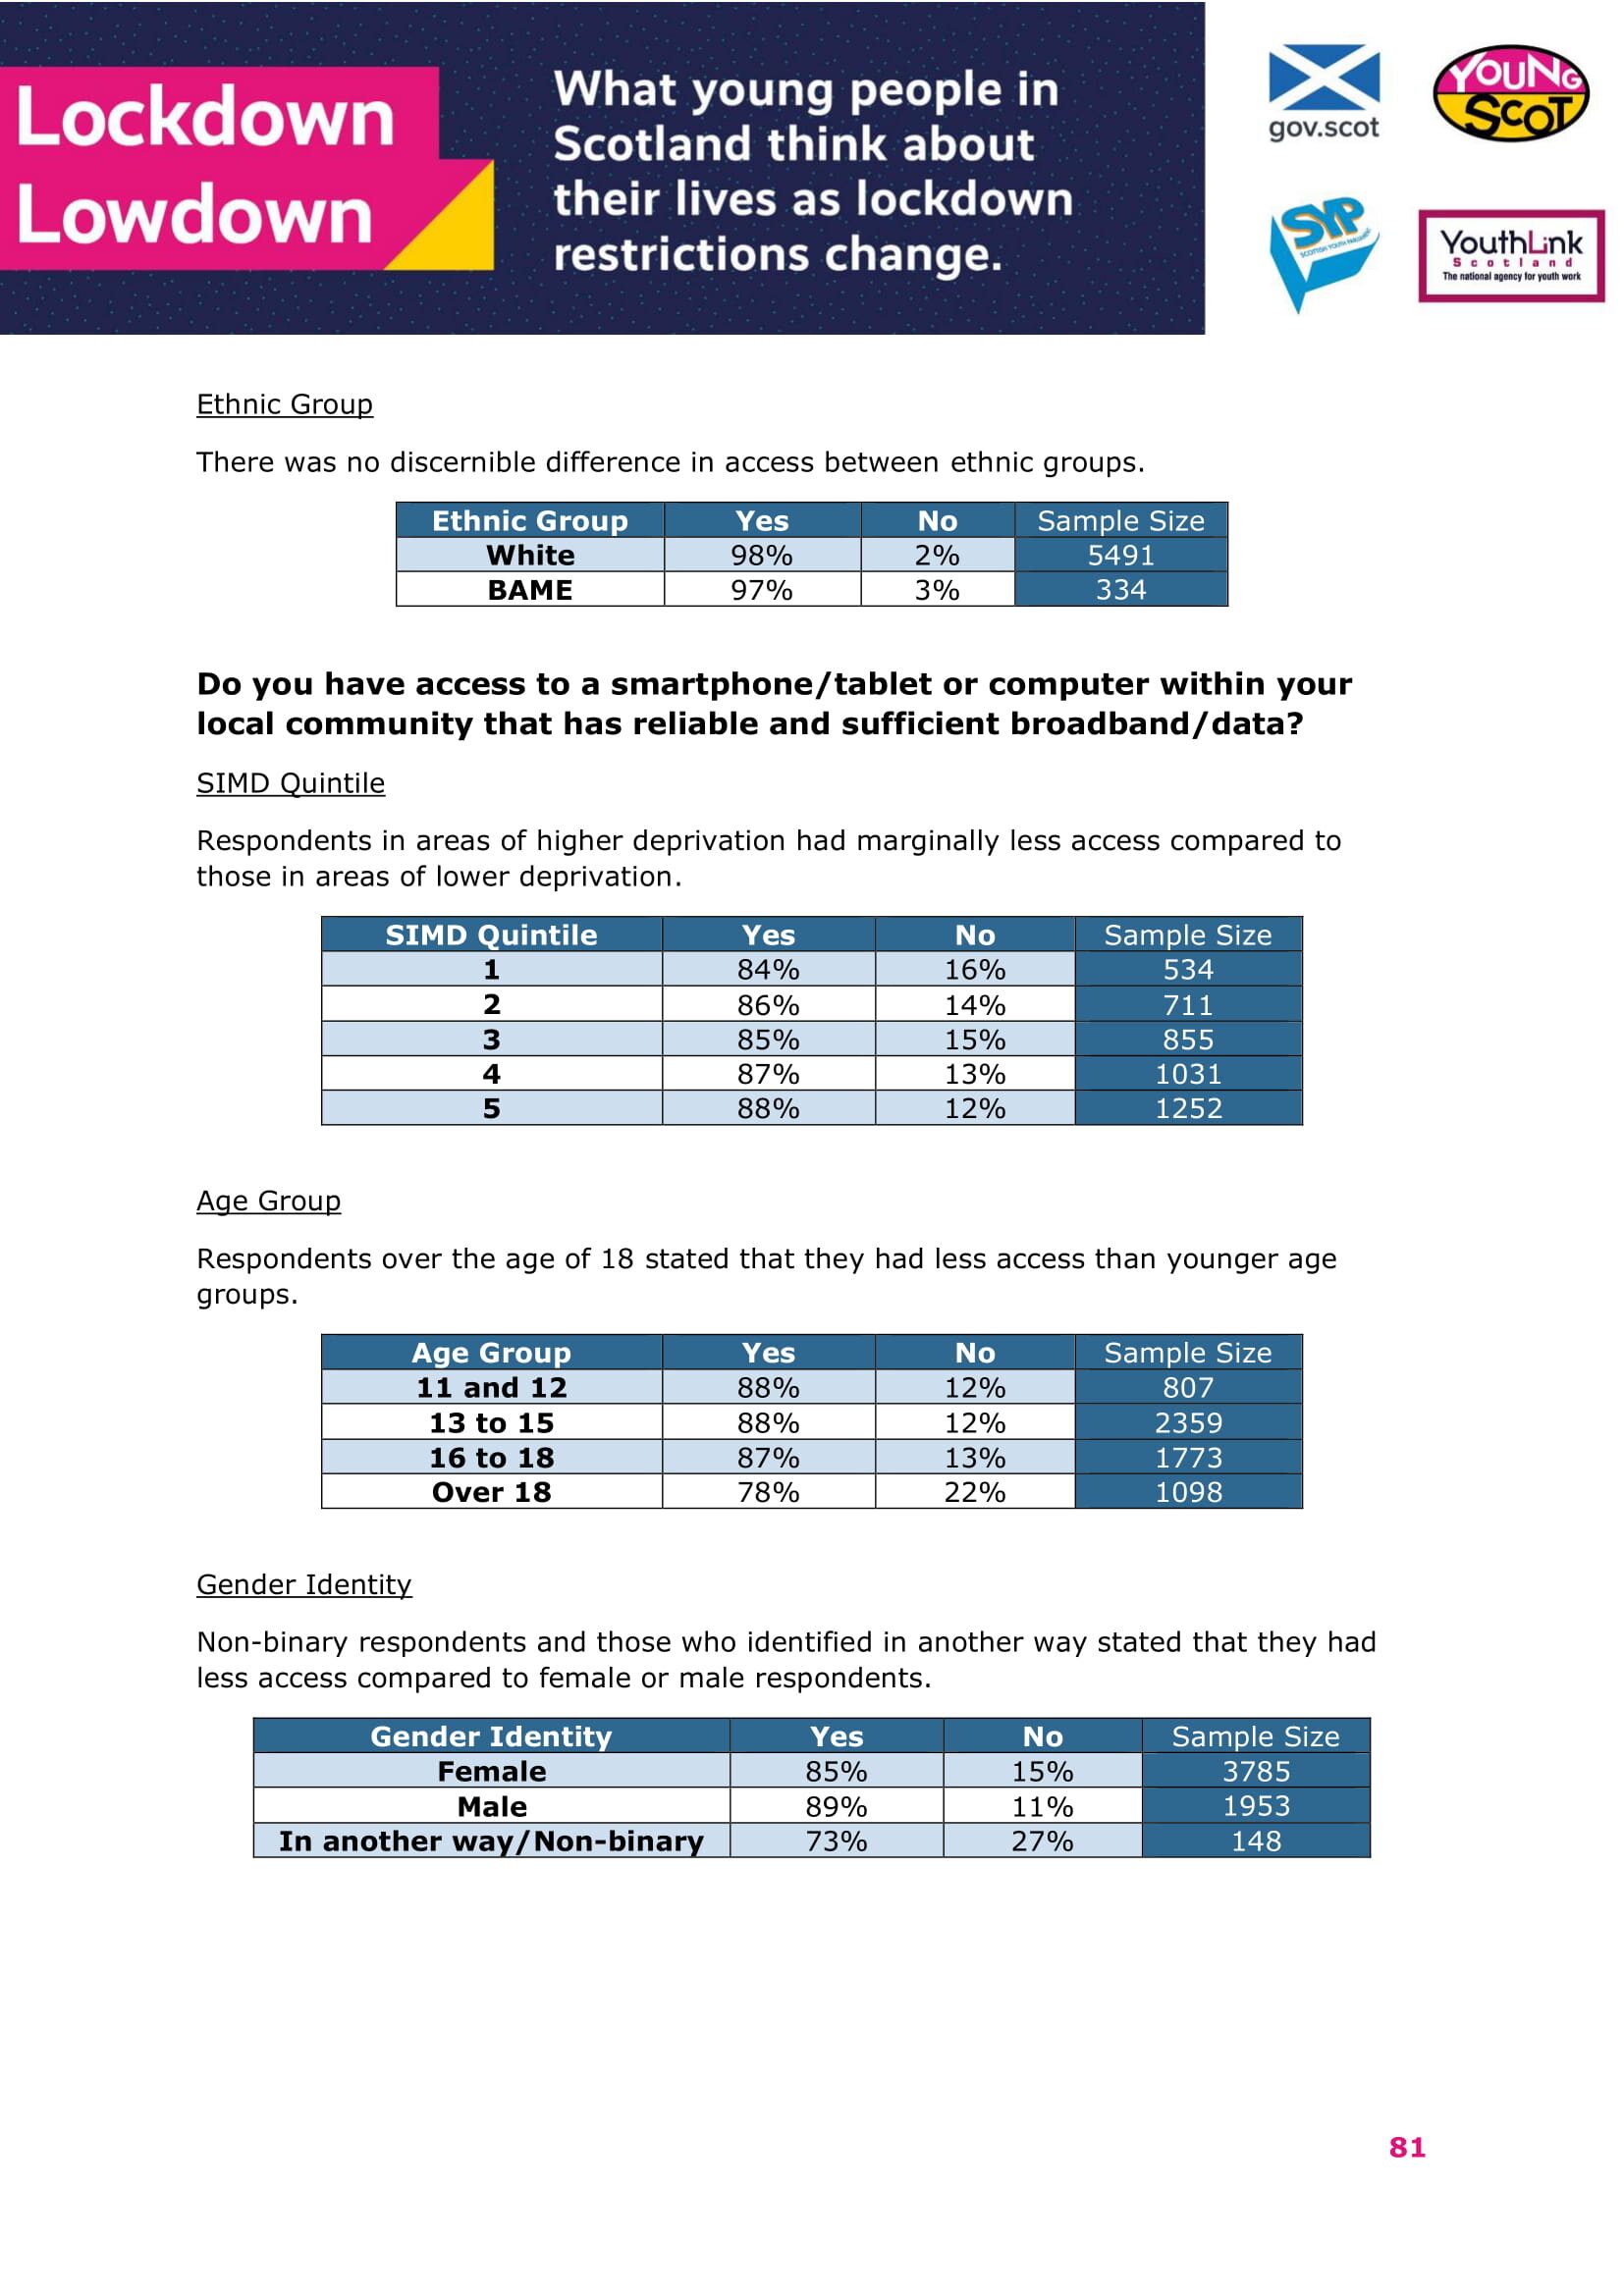
• The majority of all groups stated that they had access to a device within their local community that could connect online. Respondents in areas of higher deprivation were slightly less likely to have access compared with other groups (84% of respondents in Quintile 1 compared with 88% of respondents in Quintile 5).
Key Findings: Age Group
Respondents to the survey were aged between 11 and 26, with the majority being between 13 and 18 For the purpose of this analysis, respondents’ ages have been grouped as follows:
Age Group Respondents
11 and 12 808
13 to 15 2,360
16 to 18 1,773
Over 18 1,098
Blank 4
There were four surveys that were filled in by hand and did not provide age data.
Impact of coronavirus on education
• When respondents were asked if they were happy about the current arrangements for their educational course, younger respondents were more likely to agree with this statement than older respondents (91% of 11 and 12 year olds compared with 47% of respondents over 18 years old.
• When asked if there was anything that they would like to change about their current arrangement, the most common request for respondents under 16 was for enforcement or an increase in social distancing within educational establishments. For respondents over 16, the most common themes were around the preferred style of learning: blended or in-person. A third of respondents over the age of 18 provided a response regarding a preference for learning in person. This reflects the different educational experiences available in secondary school and higher or further education. This was a qualitative question with fewer responses compared to others.
• For those who had returned to in-person learning, the youngest and oldest age groups were most likely to agree that they were happy to be back (75% of 11 and 12 year olds and 76% of respondents over 18 compared with 63% of those aged 13 to 15 and 67% of those aged 16 to 18).
• When asked if their educational establishment had re-opened in a safe way, the youngest and oldest age groups were more likely to agree than the other groups (77% of 11 and 12 year olds and 74% of respondents over 18 compared with 60% of those aged 13 to 15 and 58% of those aged 16 to 18).
• When asked for any further thoughts on education, the most common theme for respondents aged 13 to 18 was a concern over exams. Respondents aged 11 and 12 were most concerned about missing out on learning or falling behind or having difficulty with online learning. Respondents over 18 also mostly expressed difficulty with learning online, with much more responses for this theme in this age group compared to others. This was a qualitative question with fewer responses compared to others.
Impact of coronavirus on relationships
• Younger respondents agreed that they had a good relationship with their family more than older respondents (91% of respondents aged 11 and 12 compared with 79% of respondents over 18).
• Younger respondents agreed that they had a good relationship with their friends more than older respondents (87% of respondents aged 11 and 12 compared with 76% of respondents over 18).
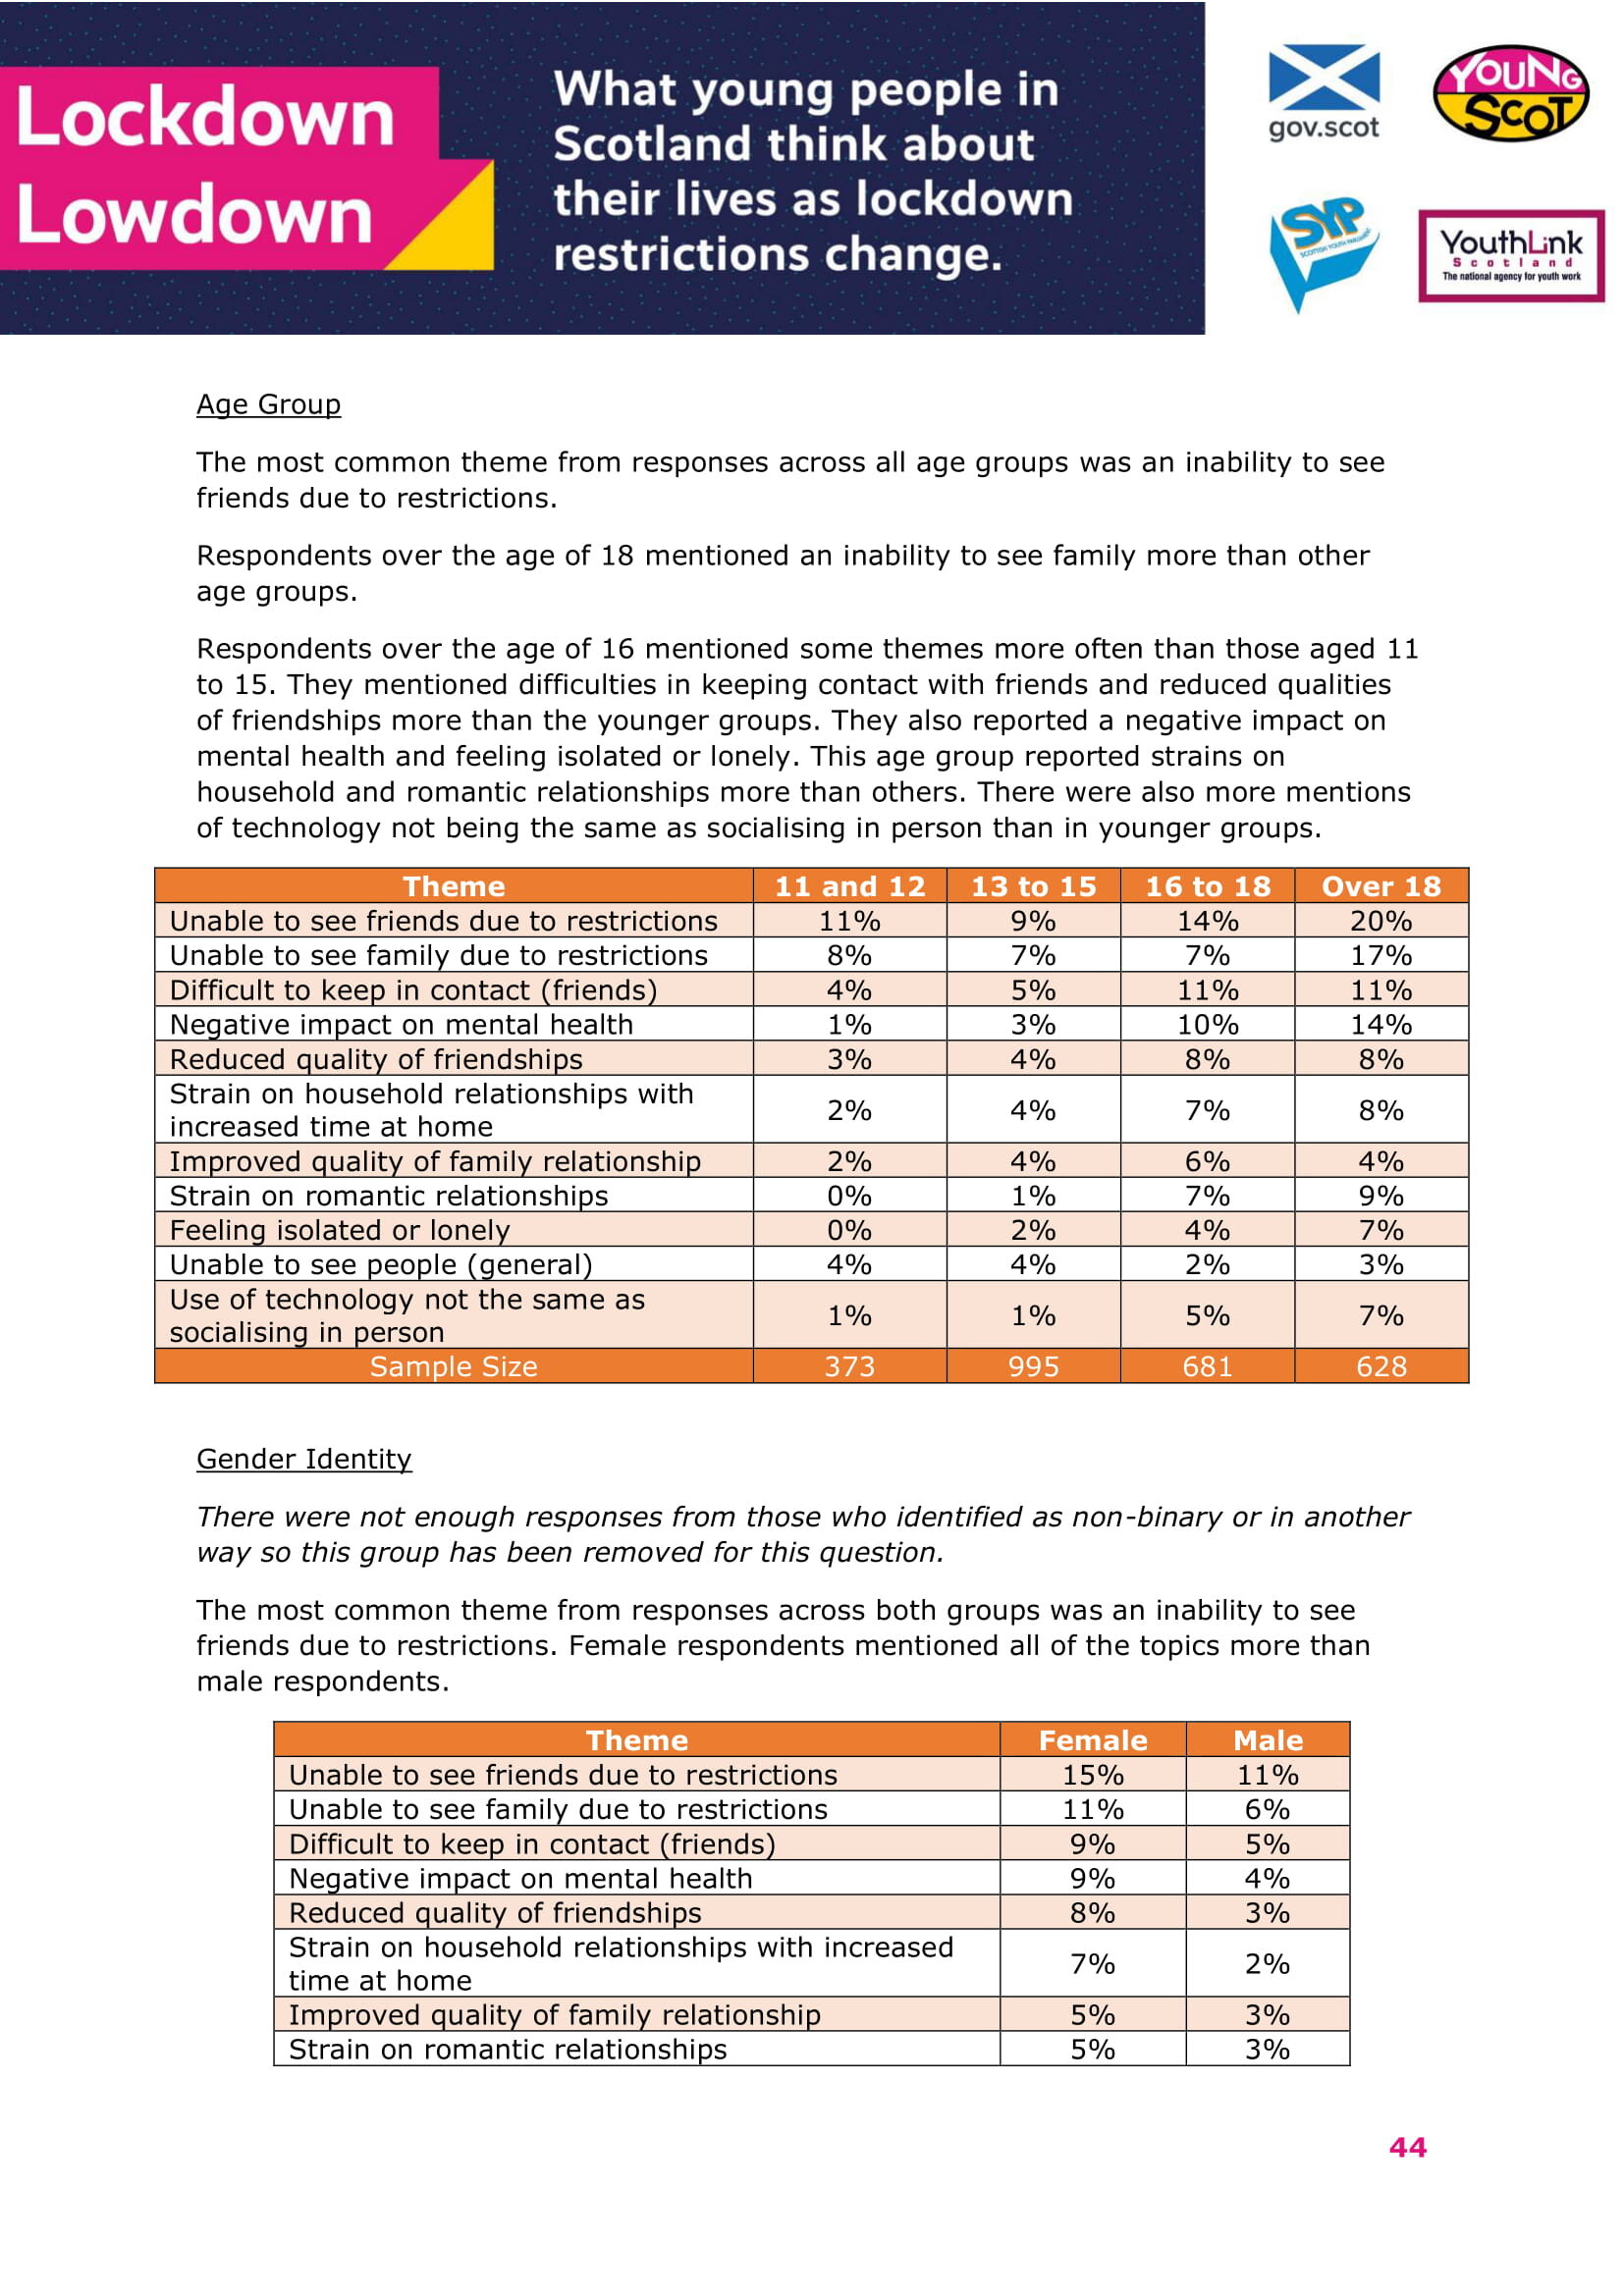
• When asked for any further thoughts on relationships, respondents over the age of 18 mentioned an inability to see family more than other age groups. Respondents over the age of 16 mentioned some themes more often than those aged 11 to 15. They mentioned difficulties in keeping contact with friends and reduced quality of friendships more than the younger groups. They also reported a negative impact on mental health and feeling isolated or lonely. This age group reported strains on household and romantic relationships more than others. There were also more mentions of technology not being the same as socialising in person than in younger groups. This was a qualitative question with fewer responses compared to others.
Impact of coronavirus on employment
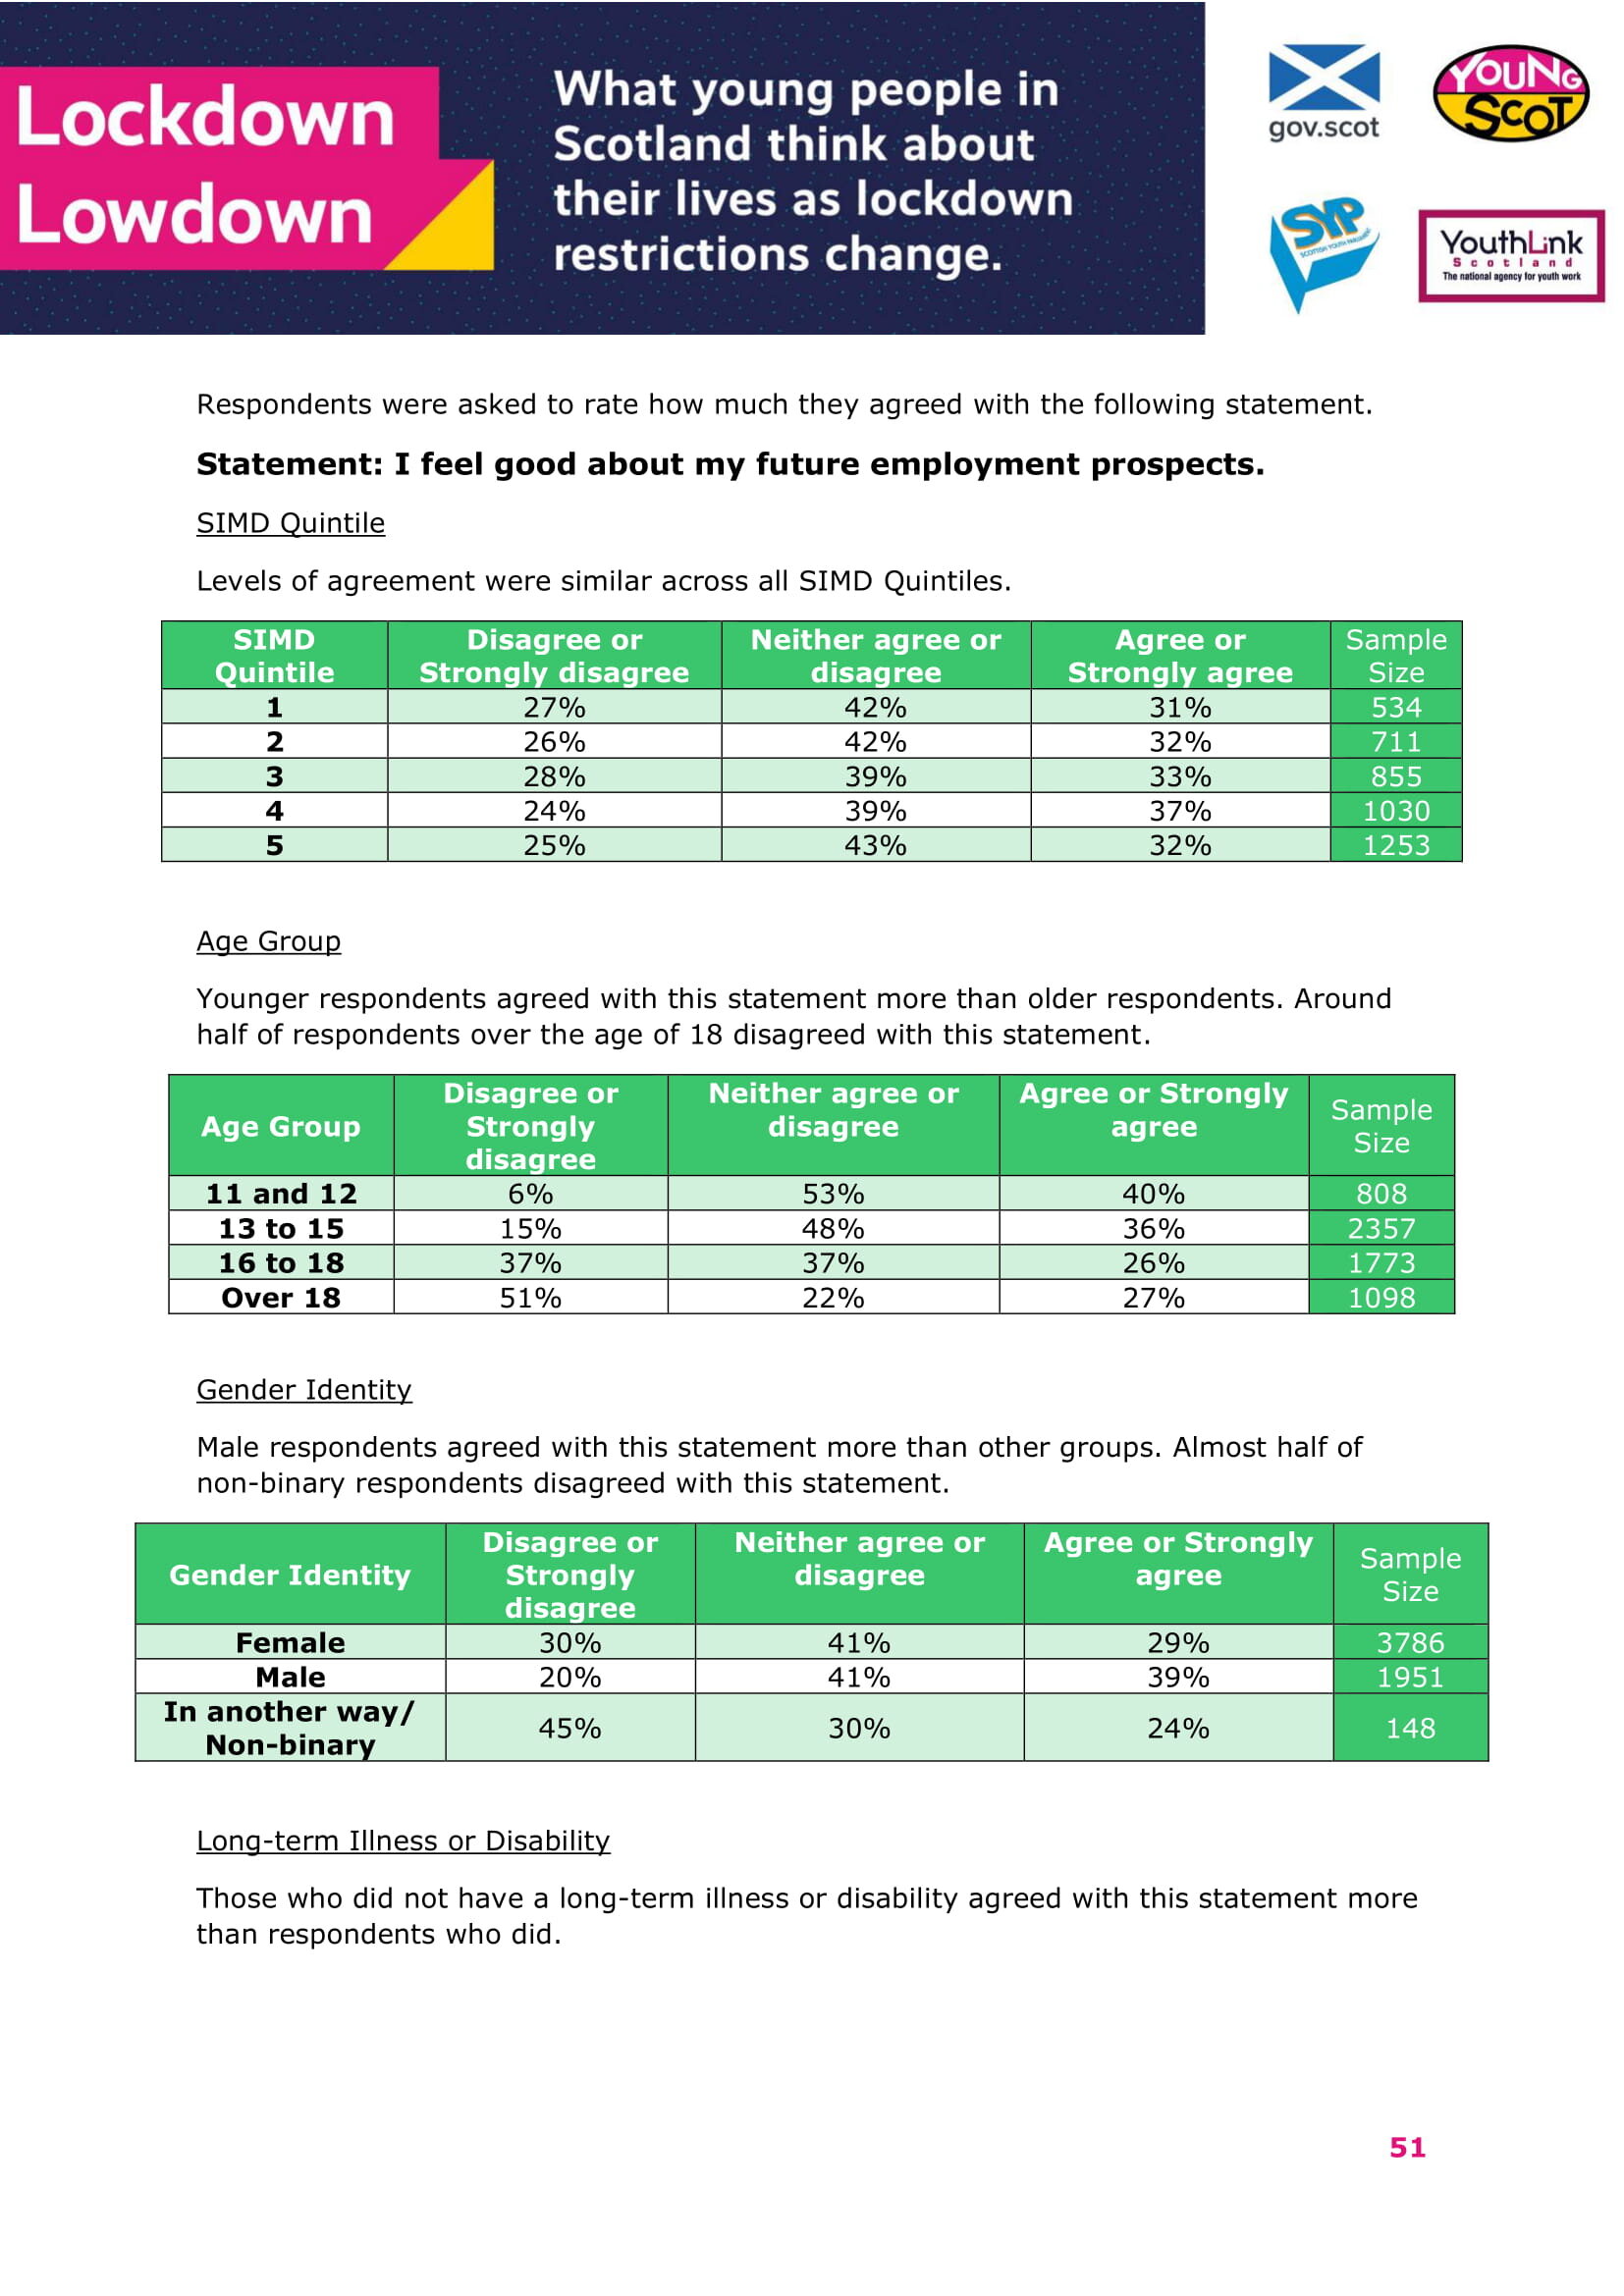
• Younger respondents were more like to agree that they felt good about their future employment prospects than older respondents (40% of respondents aged 11 and 12 compared with 26% of 16 to 18 year olds and 27% of respondents over 18).
• When asked for any further thoughts on employment, respondents aged 11 and 12 were most concerned about the negative impact of COVID on the workforce and future. Respondents who were aged 13 to 15 were most concerned about the impact of schooling/exams on their future employment. Those aged 16 to 18 highlighted that being young felt like a barrier to finding work. Respondents over 18 were most concerned about job security within their chosen industry. This was a qualitative question with fewer responses compared to others.
Impact of coronavirus generally (including mental and physical health)
• Younger respondents were much more positive about their physical wellbeing than older respondents (82% of respondents aged 11 and 12 agreed that they felt good about their physical health and wellbeing compared with 41% of respondents over 18).
• Younger respondents were much more positive about their mental wellbeing than older respondents (69% of respondents aged 11 and 12 agreed that they felt good about their mental health and wellbeing compared with 20% of respondents over 18).
• Younger respondents were more likely say that they were able to access their rights than older respondents (81% of respondents aged 11 and 12 agreed that compared with 41% of respondents over 18).
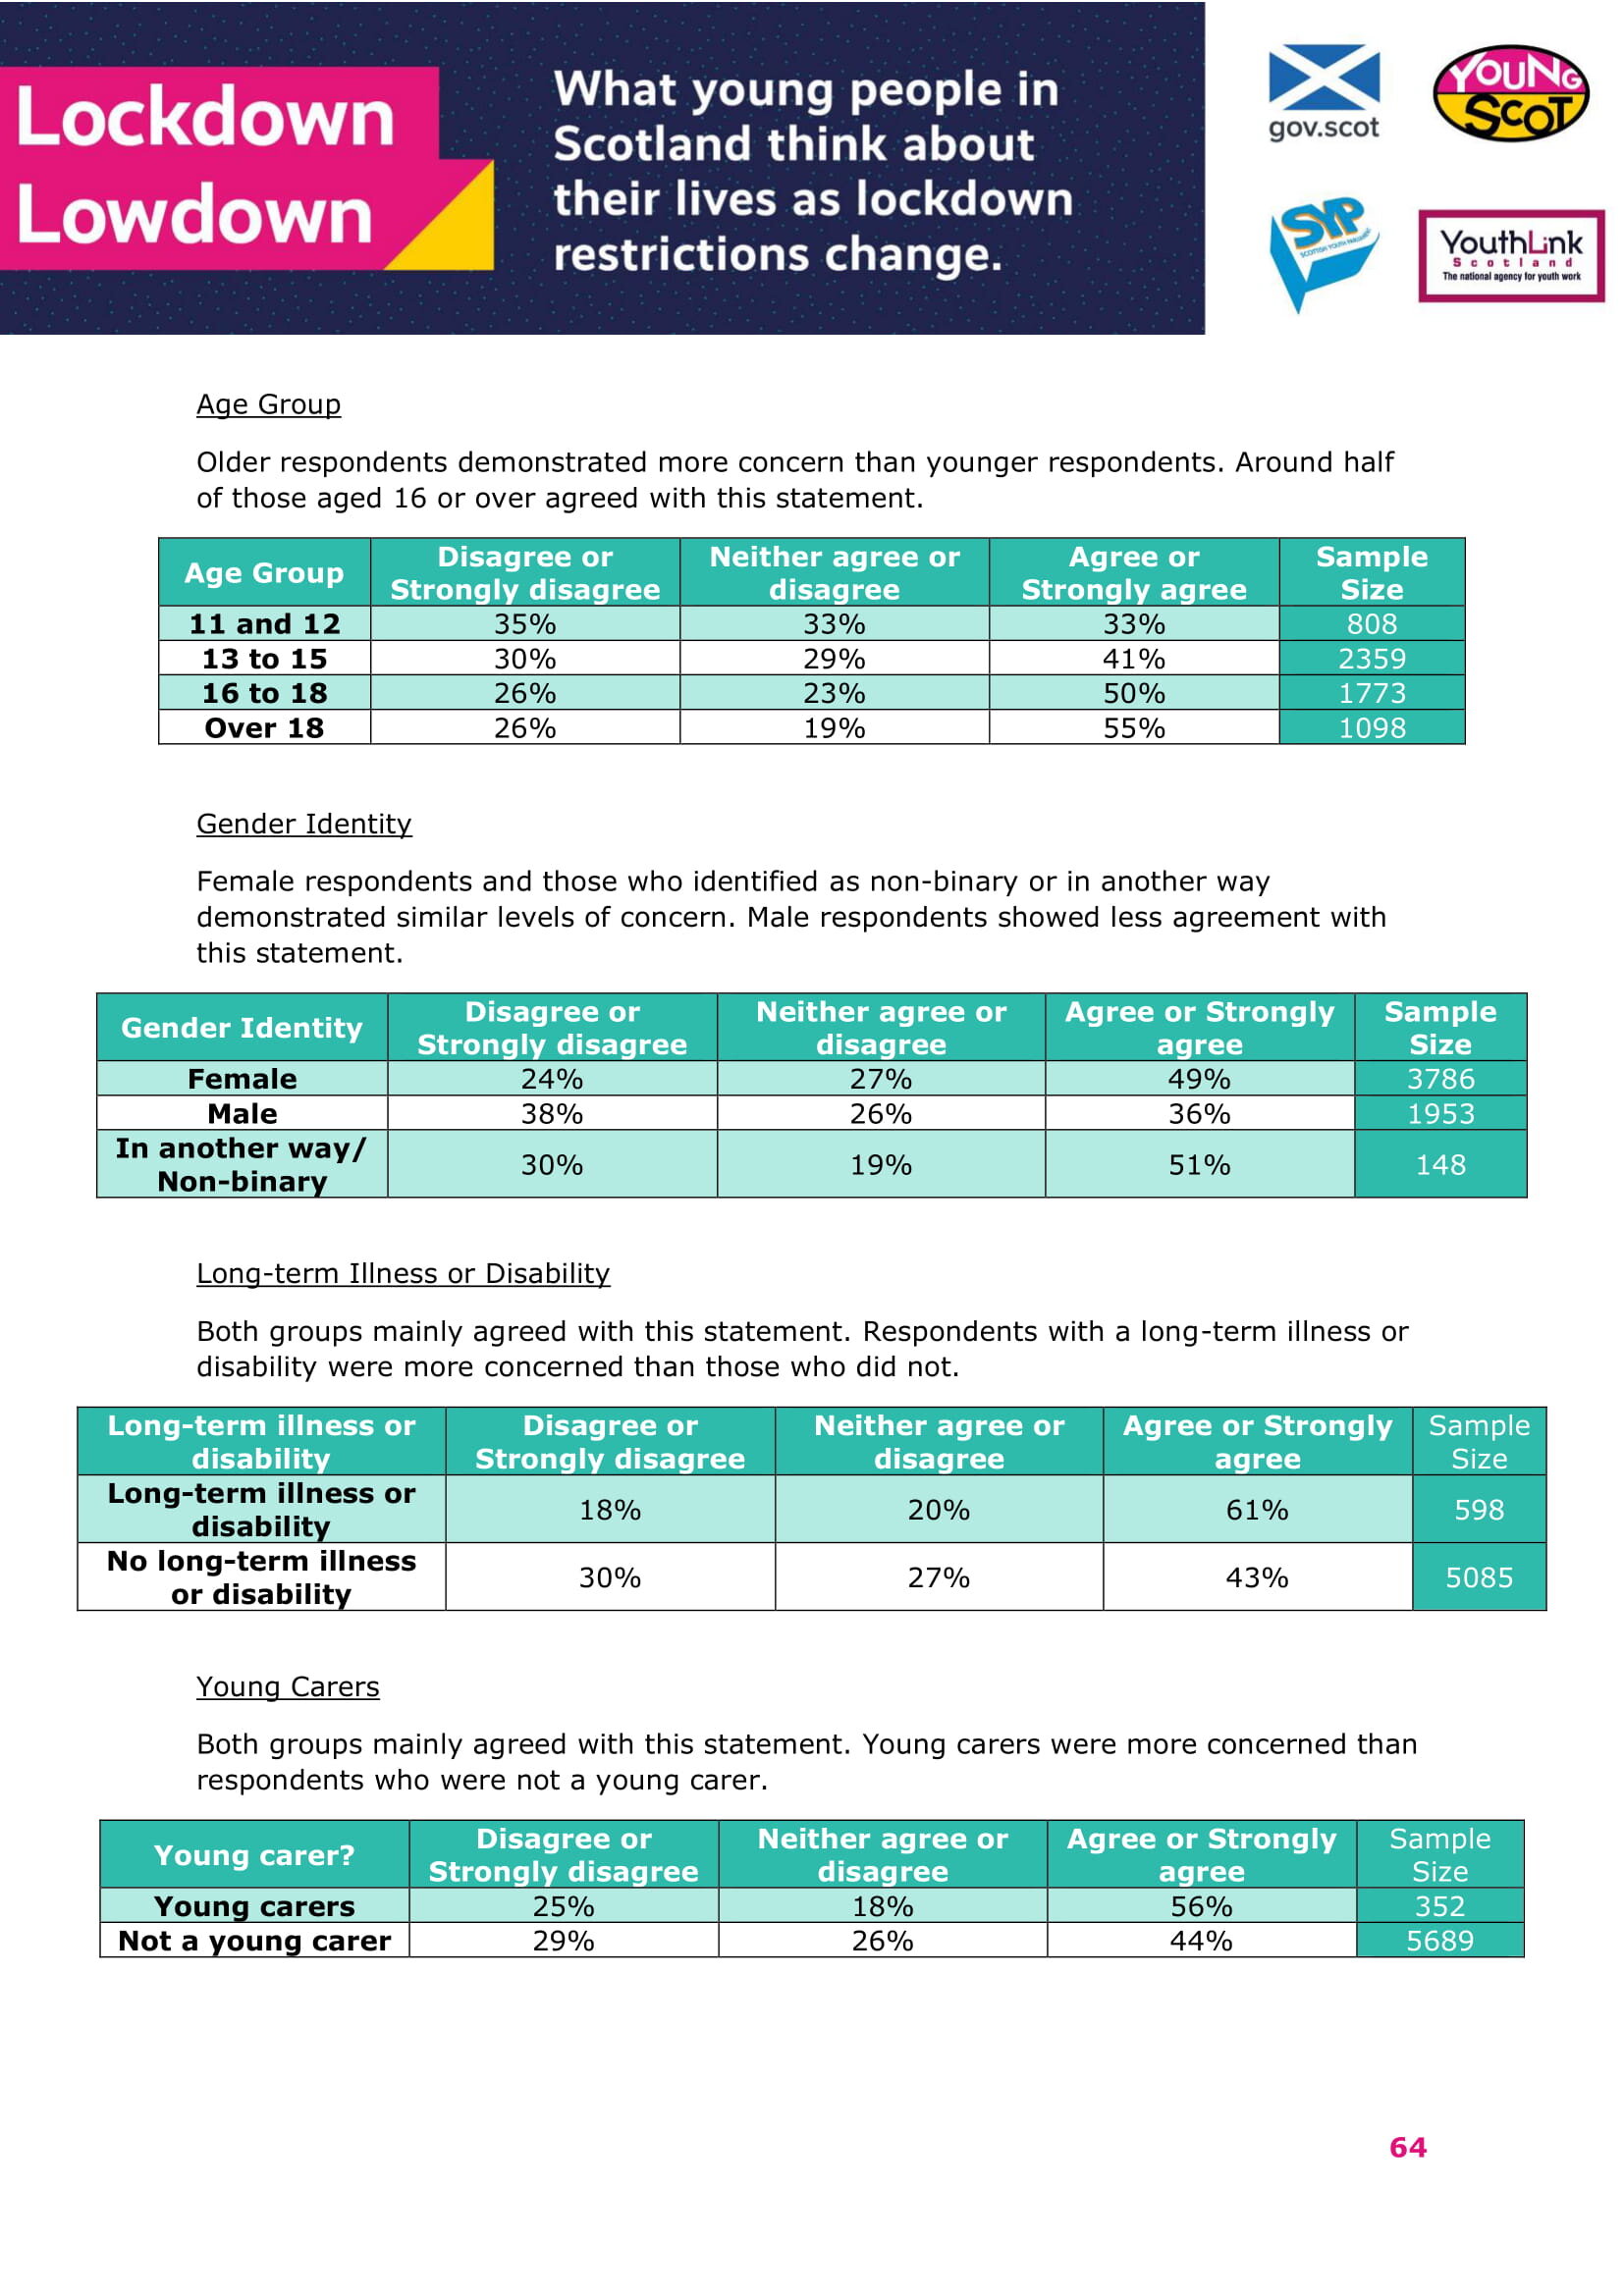
• Older respondents were more likely to be concerned about catching coronavirus than younger respondents (50% of respondents aged 16 to 18 and 55% of those over 18 agreed that they were concerned compared with 33% of respondents aged 11 and 12).
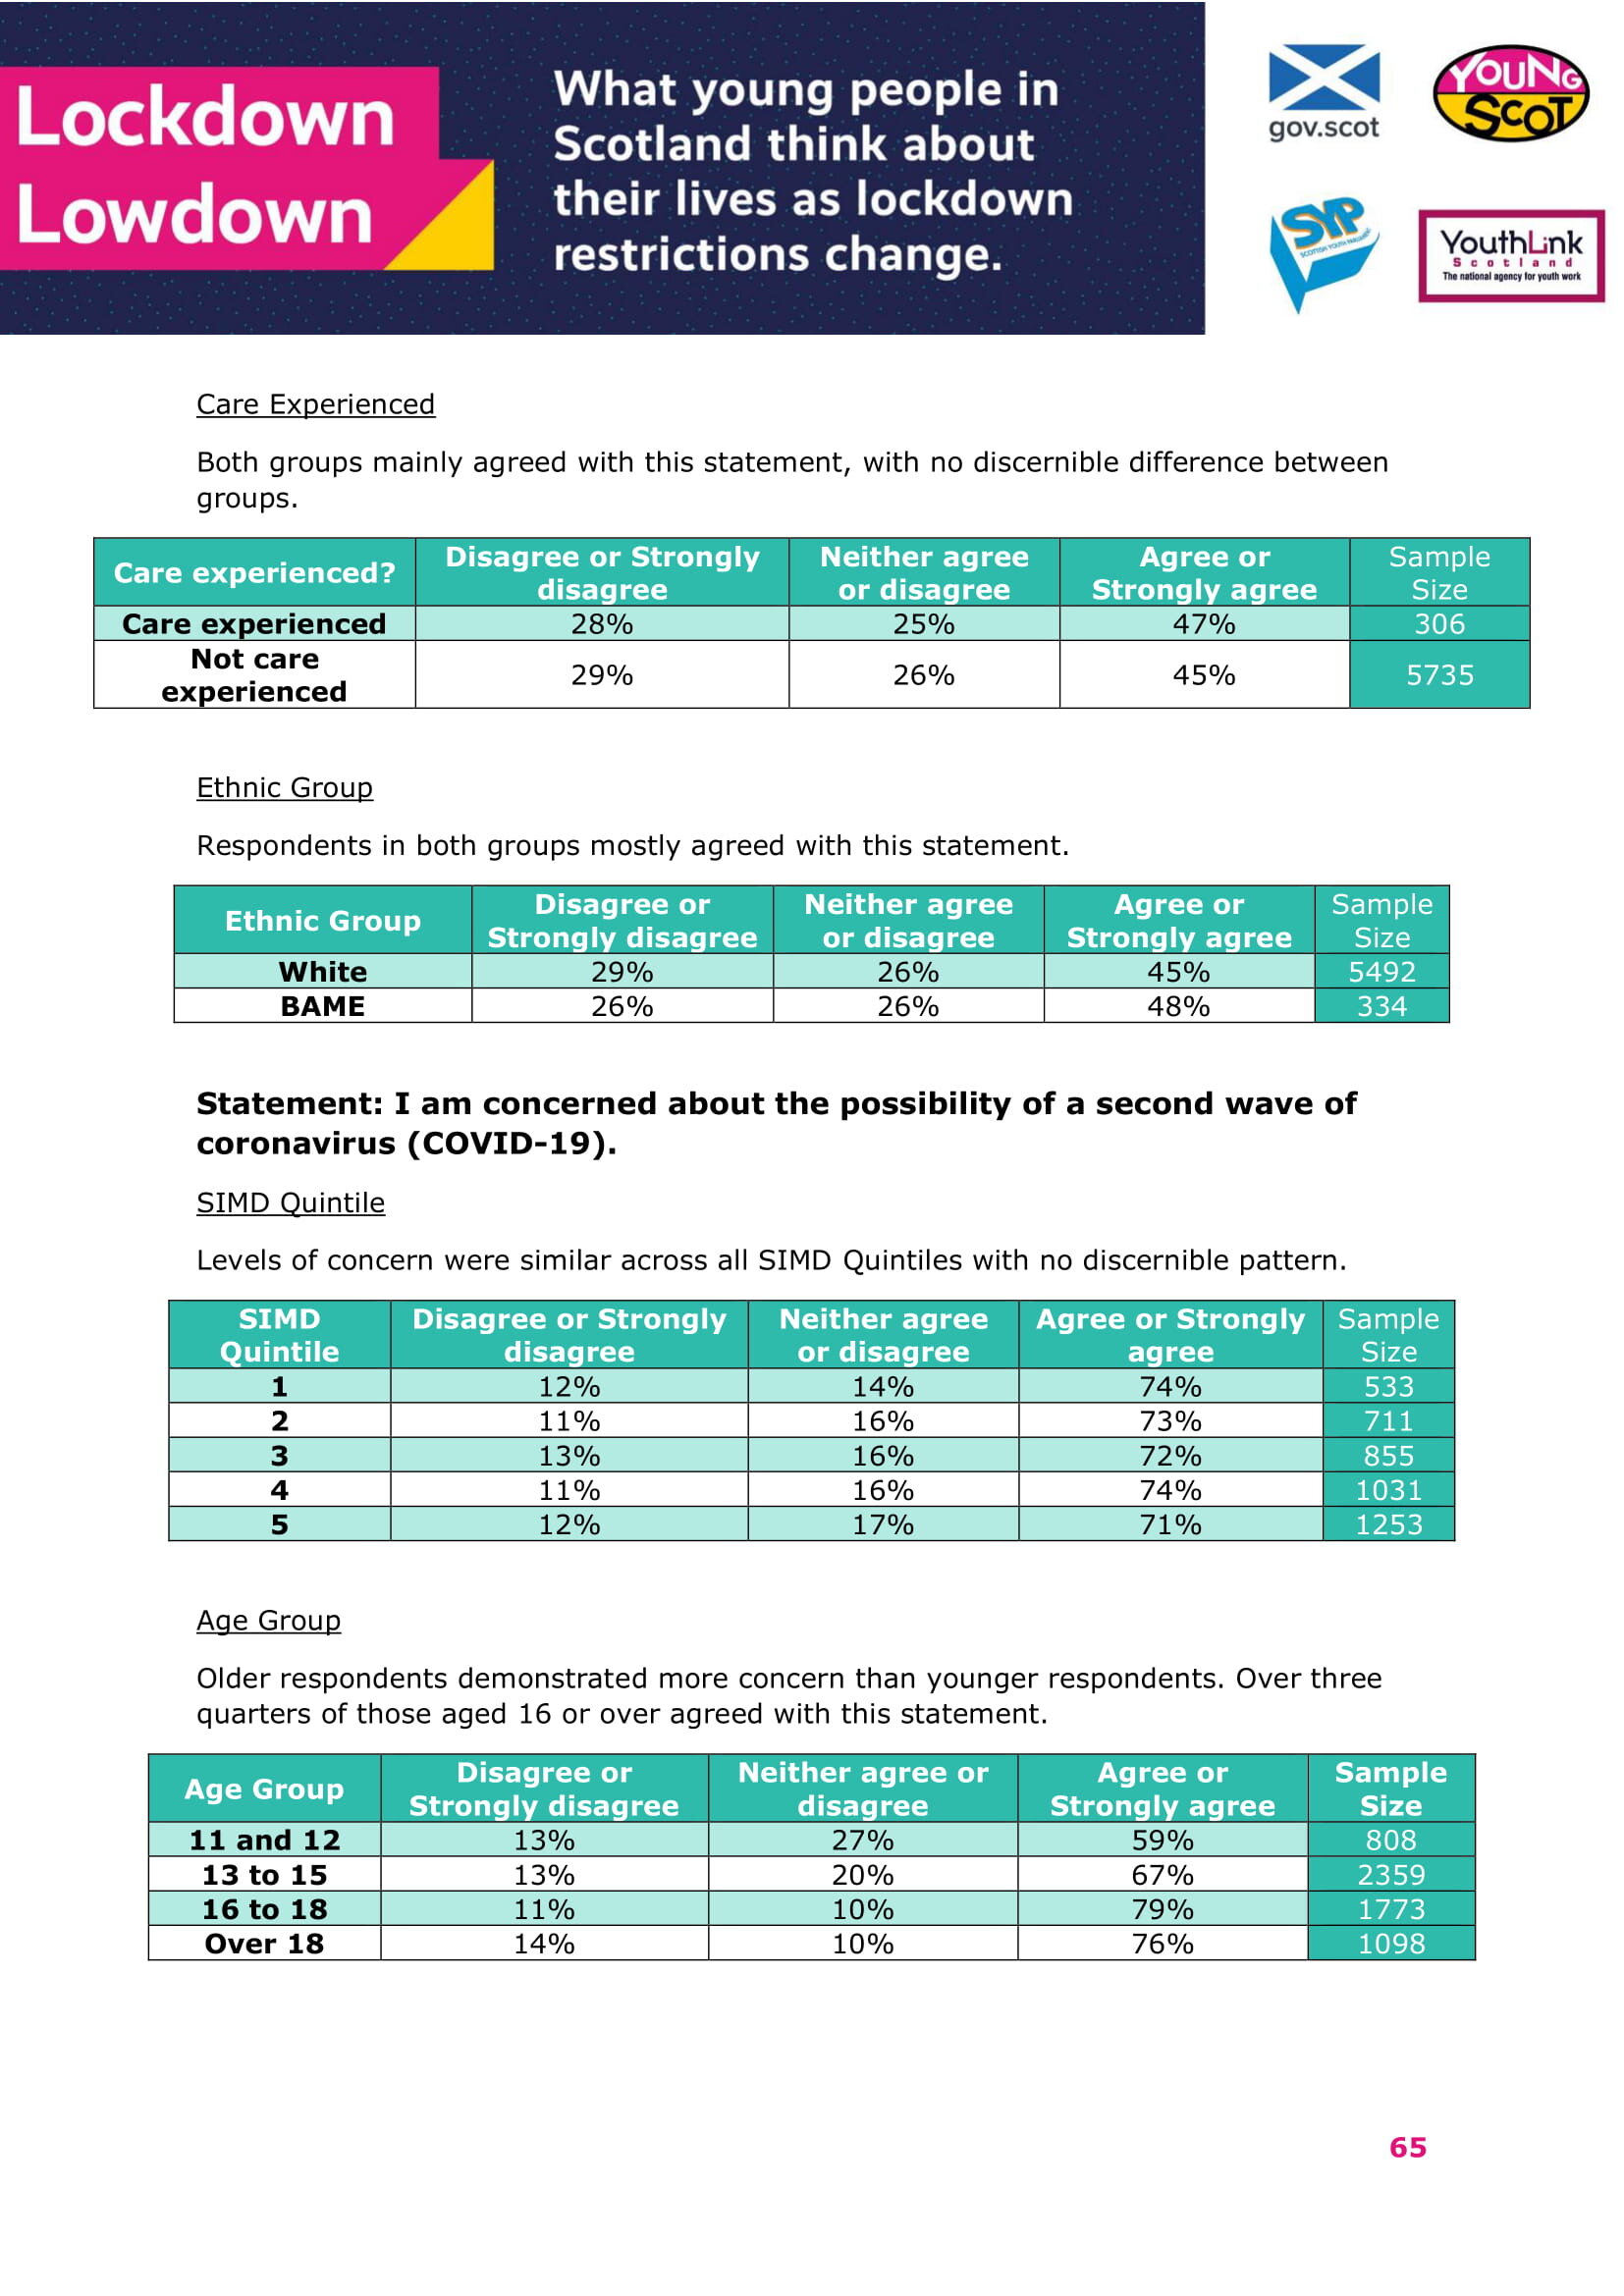
• Older respondents were more likely to be concerned about a second wave of coronavirus than younger respondents (79% of respondents aged 16 to 18 and 76% of those over 18 agreed that they were concerned compared with 59% of respondents aged 11 and 12).
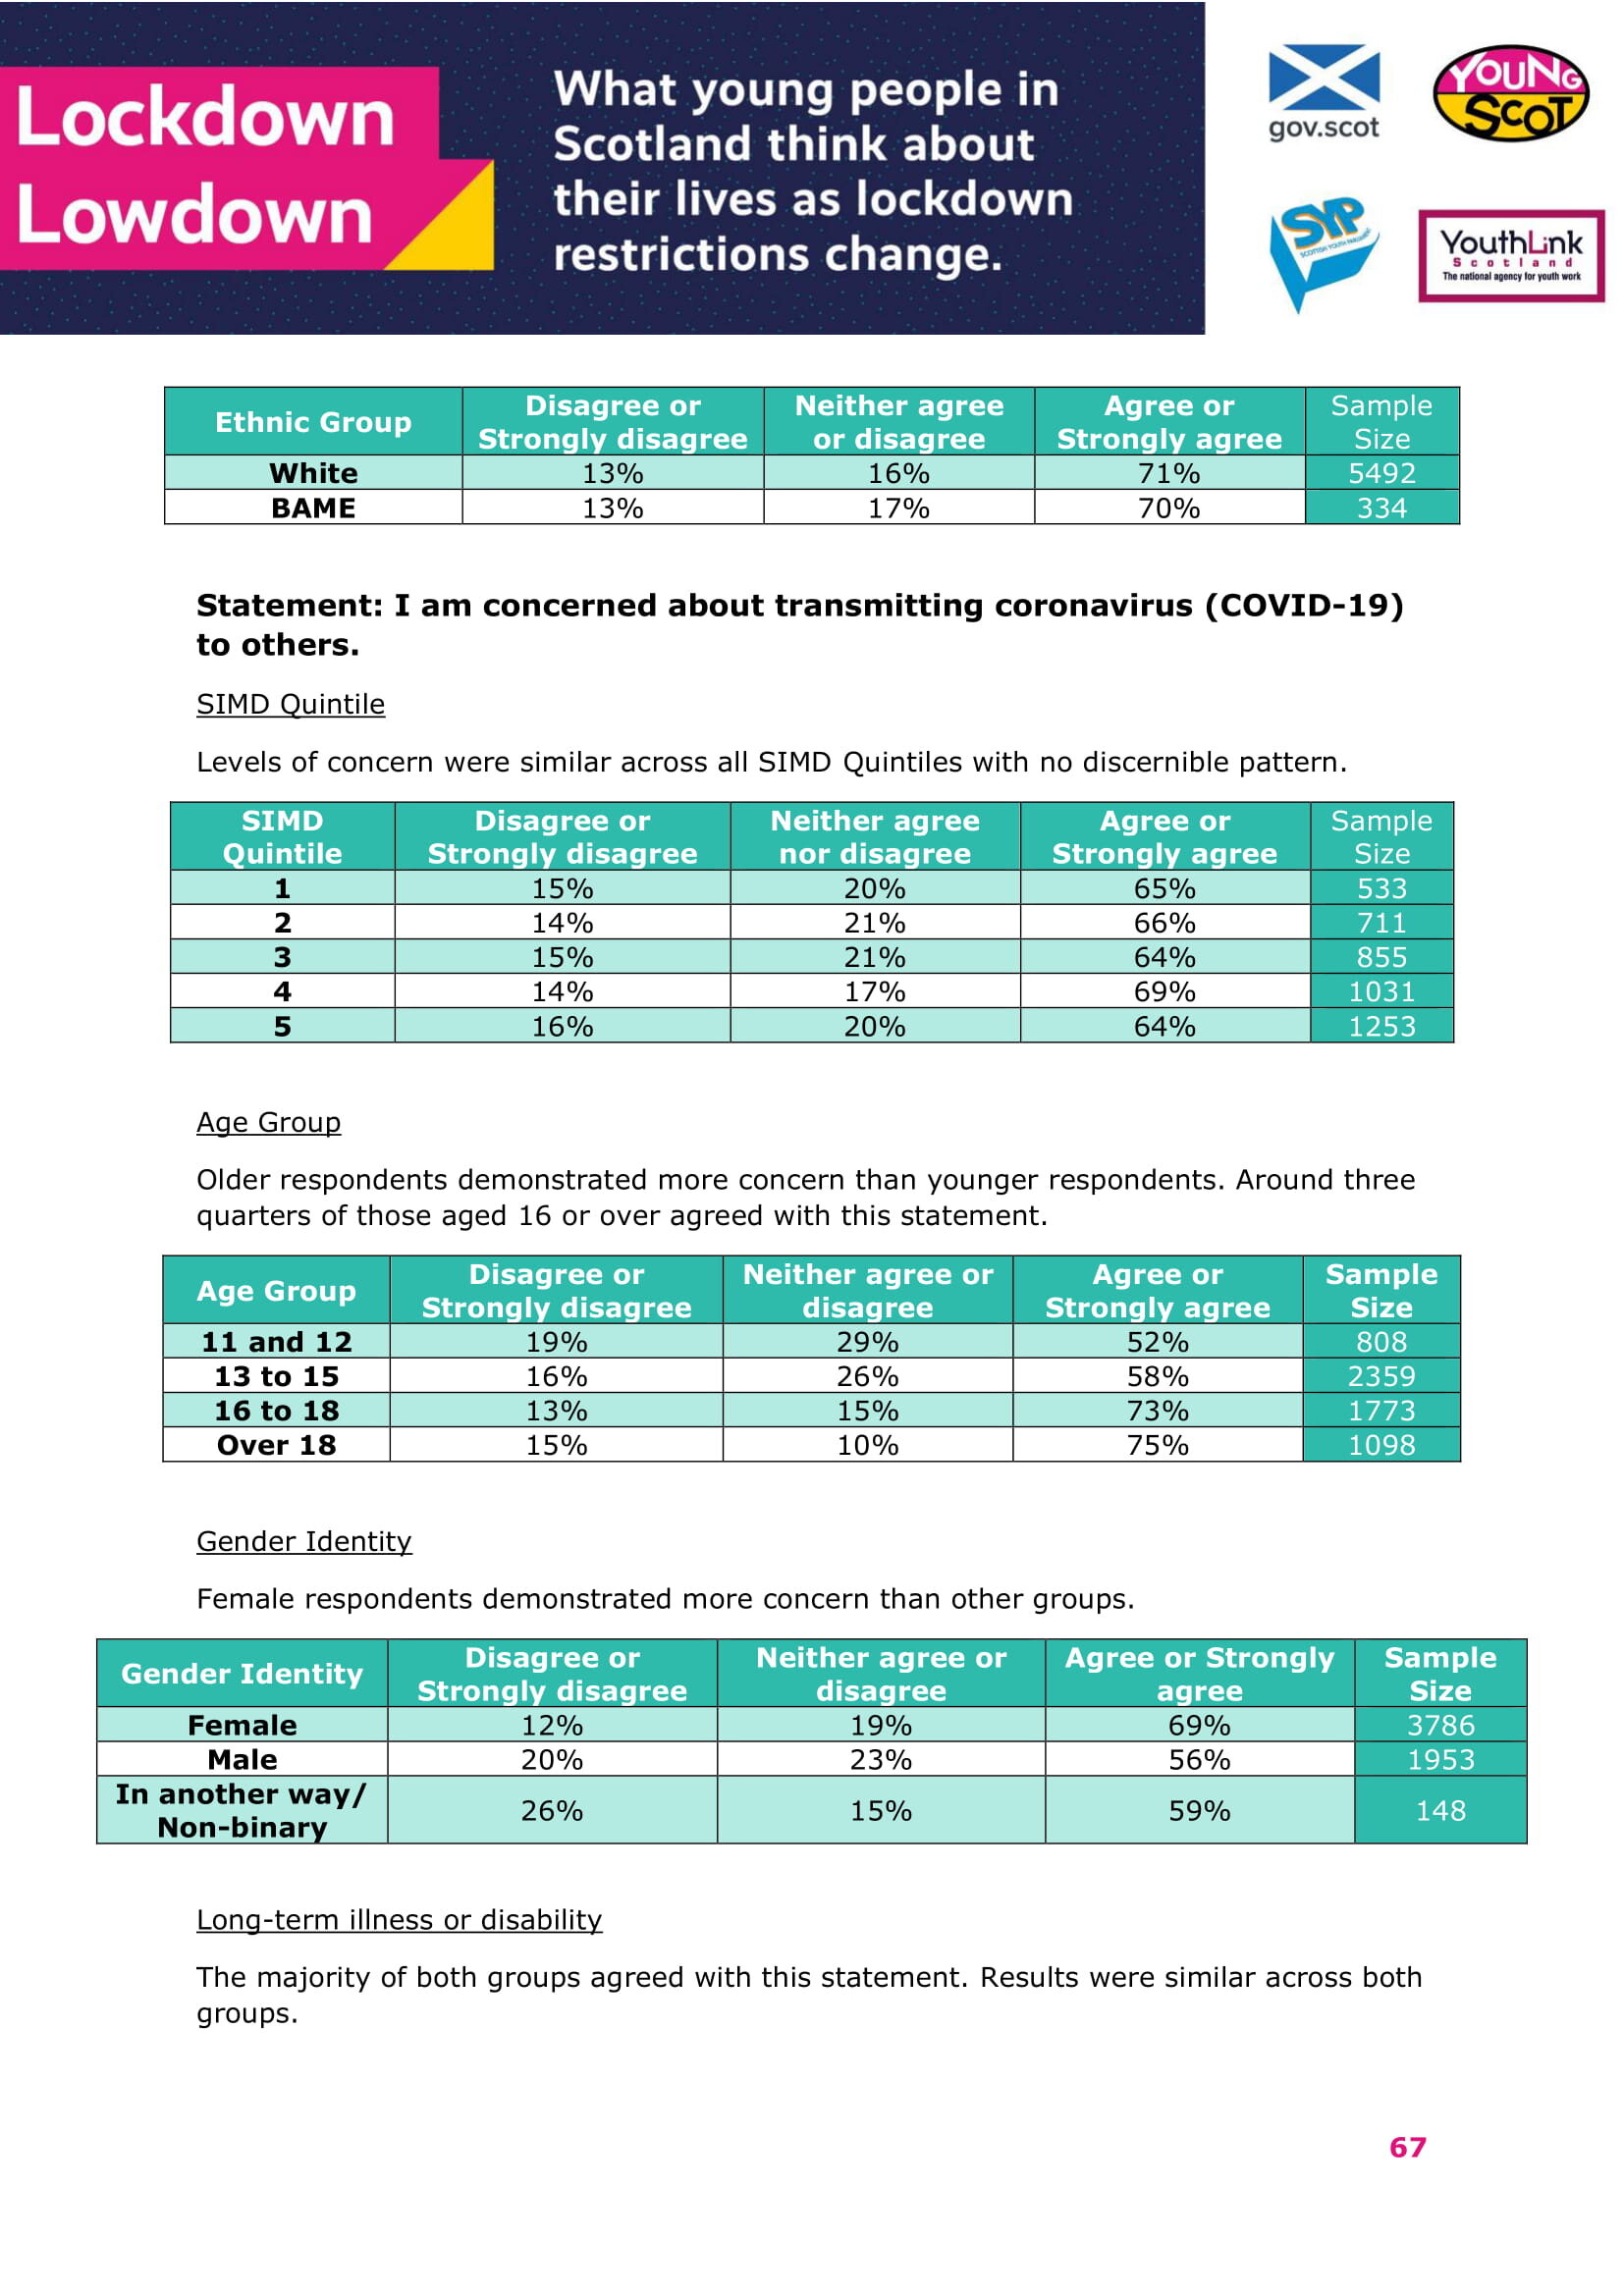
• Older respondents were more likely to be concerned about transmitting coronavirus than younger respondents (73% of respondents aged 16 to 18 and 75% of those over 18 agreed that they were concerned compared with 52% of respondents aged 11 and 12).
• When asked for further thoughts, respondents aged 16 to 18 mentioned that schools do not seem safe more than other groups. Respondents aged 16 or over said that they were not personally scared of catching the virus and offered more criticism of the governmental response more than other groups. Respondents aged over 18 mentioned a decline in mental health and the fact the people were not taking the virus seriously more than the other groups. This was a qualitative question with fewer responses compared to others.
Access to information
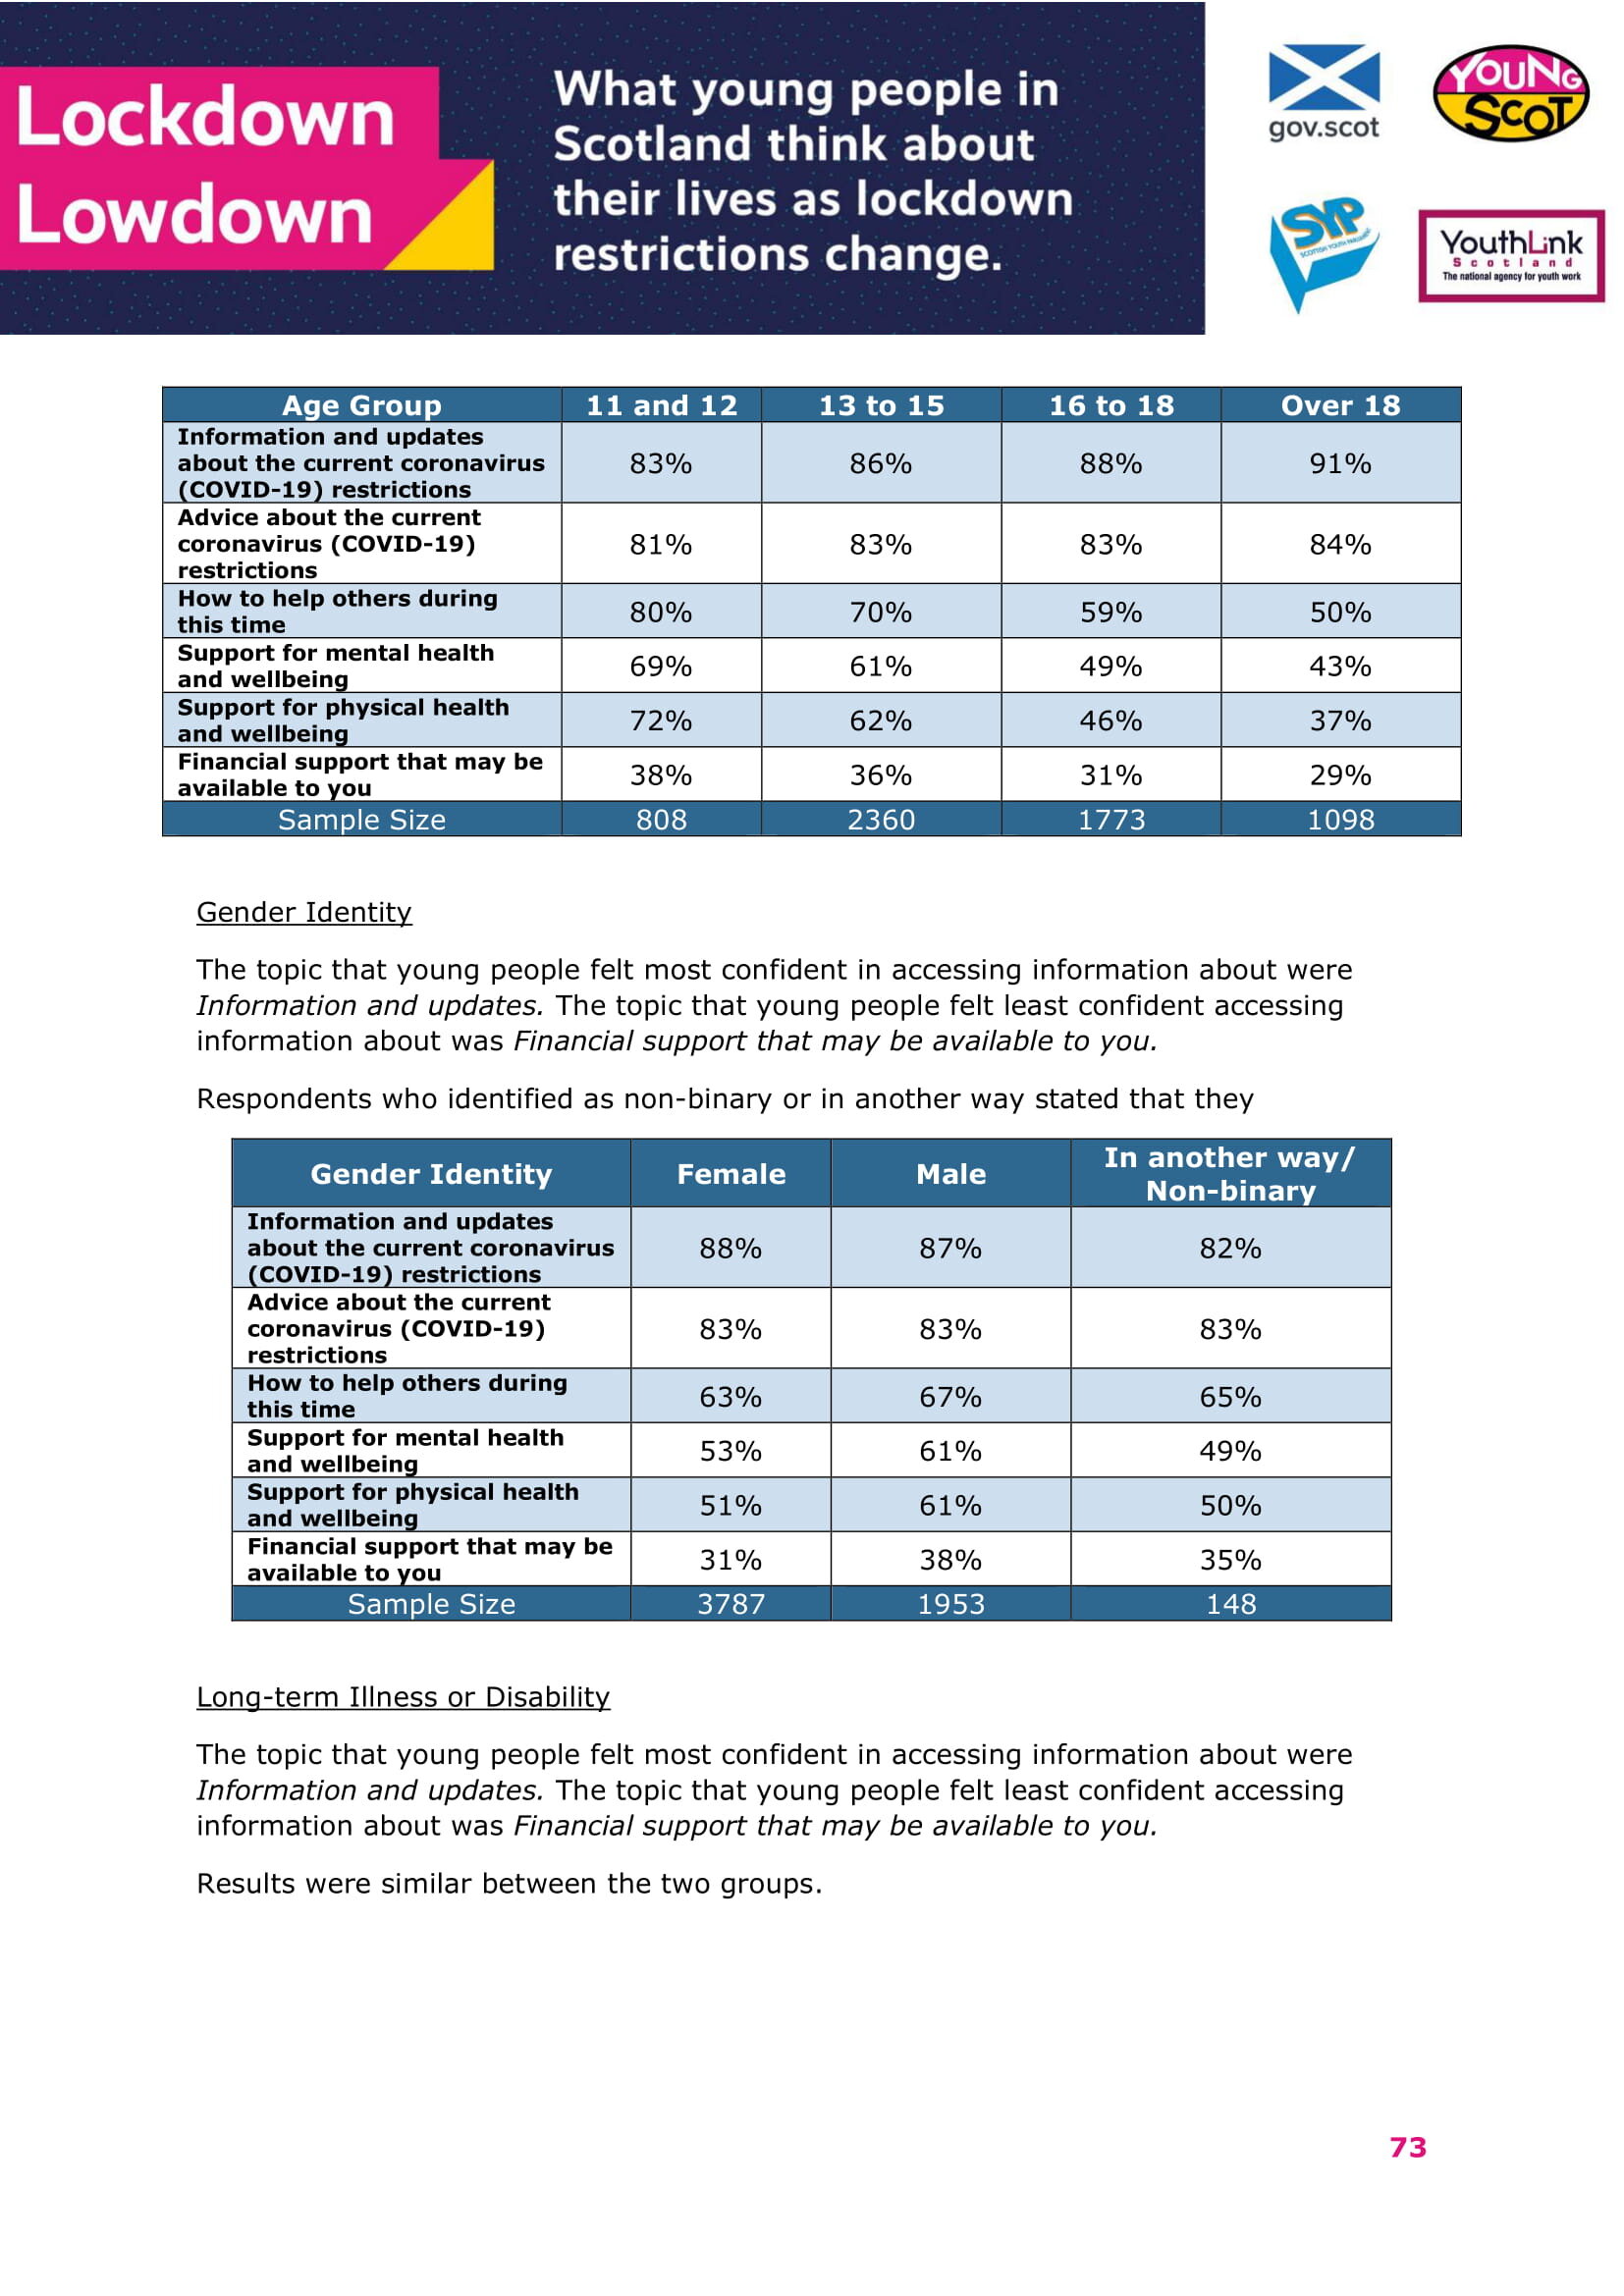
• Older respondents were slightly more likely to say that they were confident in accessing information and updates about restrictions than younger respondents (91% of respondents over 18 compared with 83% of respondents aged 11 and 12).
• Younger respondents were more likely to say that they were confident in accessing information about how to help others than older respondents (80% of respondents aged 11 and 12 compared with 50% of respondents over 18).
• Younger respondents were more likely to say that they were confident in accessing information about support for mental health and wellbeing than older respondents (69% of respondents aged 11 and 12 compared with 43% of respondents over 18).
• Younger respondents were more likely to say that they were confident in accessing information about support for physical health and wellbeing than older respondents (72% of respondents aged 11 and 12 compared with 37% of respondents over 18).
• When asked if there were any topics that respondents wanted more information on, almost all age groups stated support for mental and physical wellbeing. The topic most mentioned by respondents aged 13 to 15 was education or schools. This was a qualitative question with fewer responses compared to others.
• Respondents over the age of 18 were less likely to have access to an online device in their community than other age groups (78% compared with 88% of respondents aged 11 to 15 and 87% of those aged 16 to 18).
• When asked for any further thoughts on access to information, the most common theme from the majority of groups was that that information is confusing and needs to be more accessible. Conversely, respondents aged 11 and 12 mostly thought that information is clear and accessible. This was a qualitative question with fewer responses compared to others.
Key Findings: Gender Identity
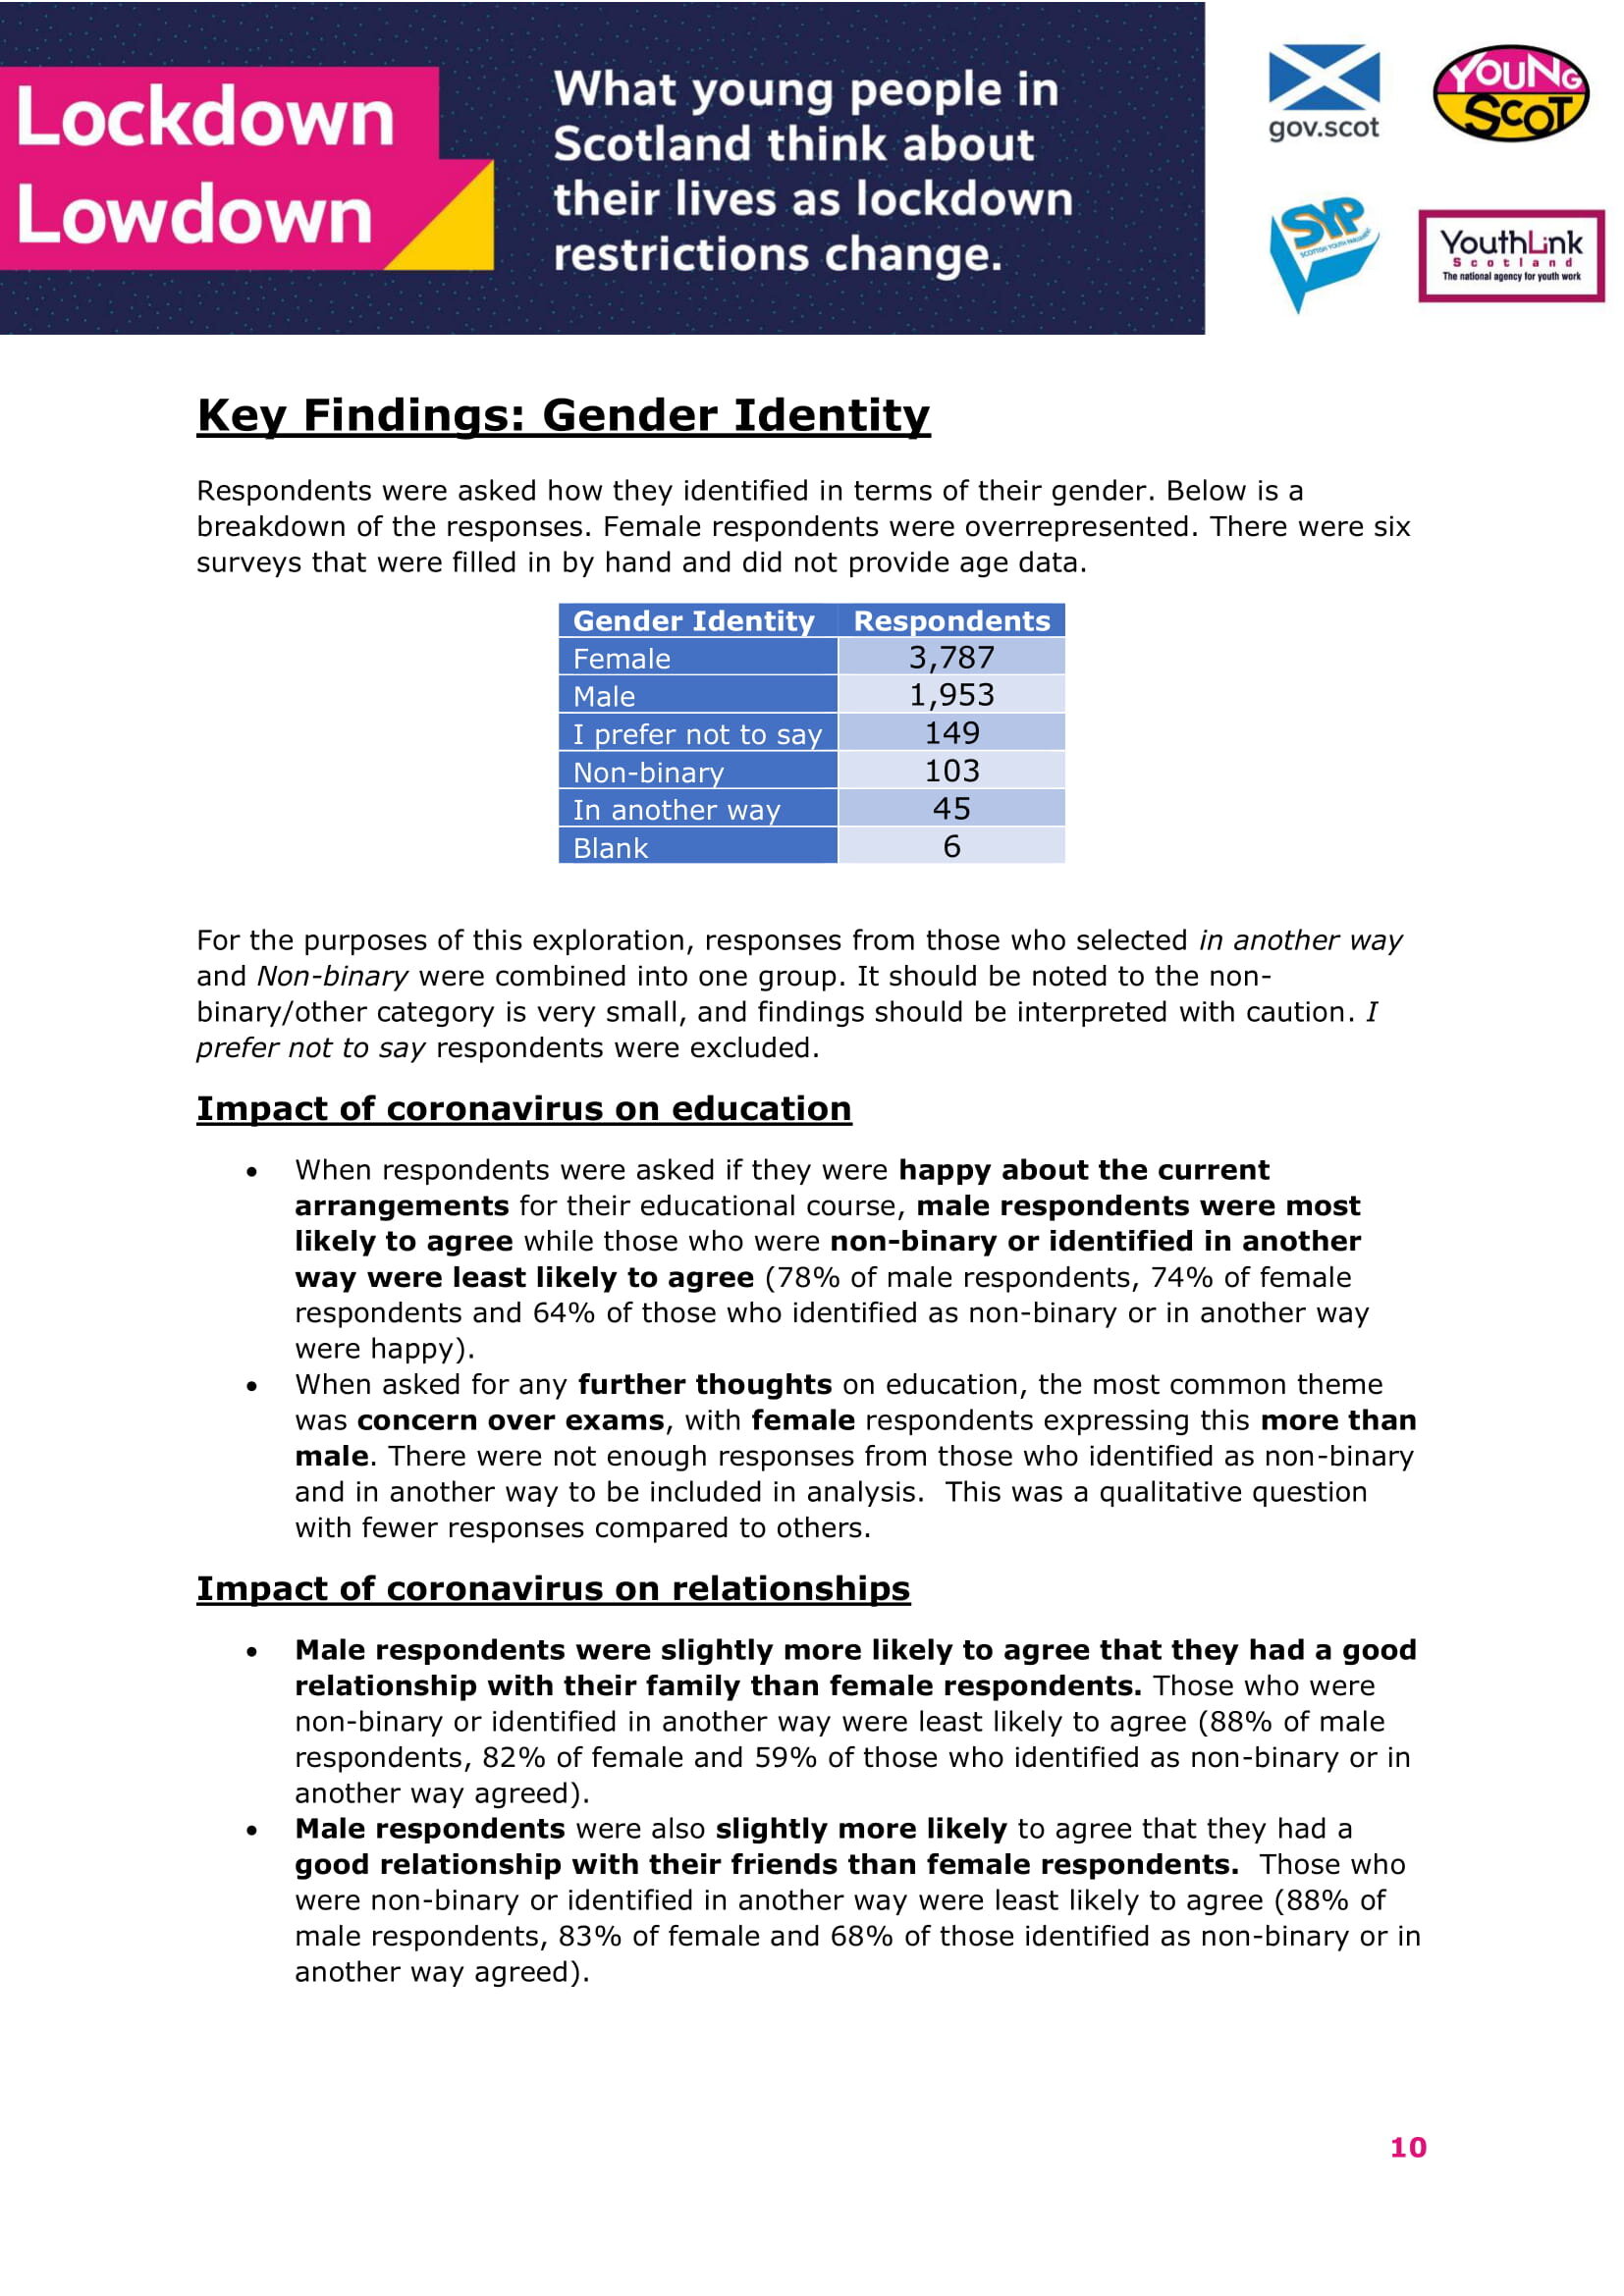
Respondents were asked how they identified in terms of their gender. Below is a breakdown of the responses. Female respondents were overrepresented. There were six surveys that were filled in by hand and did not provide age data.
Gender Identity Respondents
Female 3,787
Male 1,953
I prefer not to say 149
Non-binary 103
In another way 45
Blank 6
For the purposes of this exploration, responses from those who selected in another way and Non-binary were combined into one group. It should be noted to the non-binary/other category is very small, and findings should be interpreted with caution. I prefer not to say respondents were excluded.
Impact of coronavirus on education
• When respondents were asked if they were happy about the current arrangements for their educational course, male respondents were most likely to agree while those who were non-binary or identified in another way were least likely to agree (78% of male respondents, 74% of female respondents and 64% of those who identified as non-binary or in another way were happy).
• When asked for any further thoughts on education, the most common theme was concern over exams, with female respondents expressing this more than male. There were not enough responses from those who identified as non-binary and in another way to be included in analysis. This was a qualitative question with fewer responses compared to others.
Impact of coronavirus on relationships
• Male respondents were slightly more likely to agree that they had a good relationship with their family than female respondents. Those who were non-binary or identified in another way were least likely to agree (88% of male respondents, 82% of female and 59% of those who identified as non-binary or in another way agreed).
• Male respondents were also slightly more likely to agree that they had a good relationship with their friends than female respondents. Those who were non-binary or identified in another way were least likely to agree (88% of male respondents, 83% of female and 68% of those identified as non-binary or in another way agreed).
Impact of coronavirus on employment
• Male respondents were most likely to agree that they felt good about their future employment prospects (39% compared to 29% of female respondents and 24% of those who identified as non-binary or in another way.
• When asked for any further thoughts on employment, the most common theme from female respondents was the opinion that being young is a barrier to finding or losing work. The most common theme from male respondents was the negative impact of COVID on the workforce and future. There were not enough responses from those who identified as non-binary and in another way to be included in analysis. This was a qualitative question with fewer responses compared to others.
Impact of coronavirus generally (including mental and physical health)
• Female respondents agreed that they felt good about their physical health and wellbeing less than male respondents (55% compared with 71%). Only 30% of respondents who identified as non-binary or in another way agreed with this statement.
• Male respondents were substantially more likely to agree that they felt good about their mental health and wellbeing (59%) than female respondents (34%) and respondents who identified as non-binary or in a different way (18%).
• In terms of feeling able to access their rights as a young person, male respondents agreed with this statement much more than other groups, with those who identified as non-binary or in another way demonstrating the lowest levels of agreement (70% of male respondents, 62% of female respondents and 45% of those who identified as non-binary or other agreed).
• Female respondents and those who identified as non-binary or in another way were similarly as likely to be concerned about catching coronavirus (49% and 51%). Male respondents were less likely to be concerned (36%).
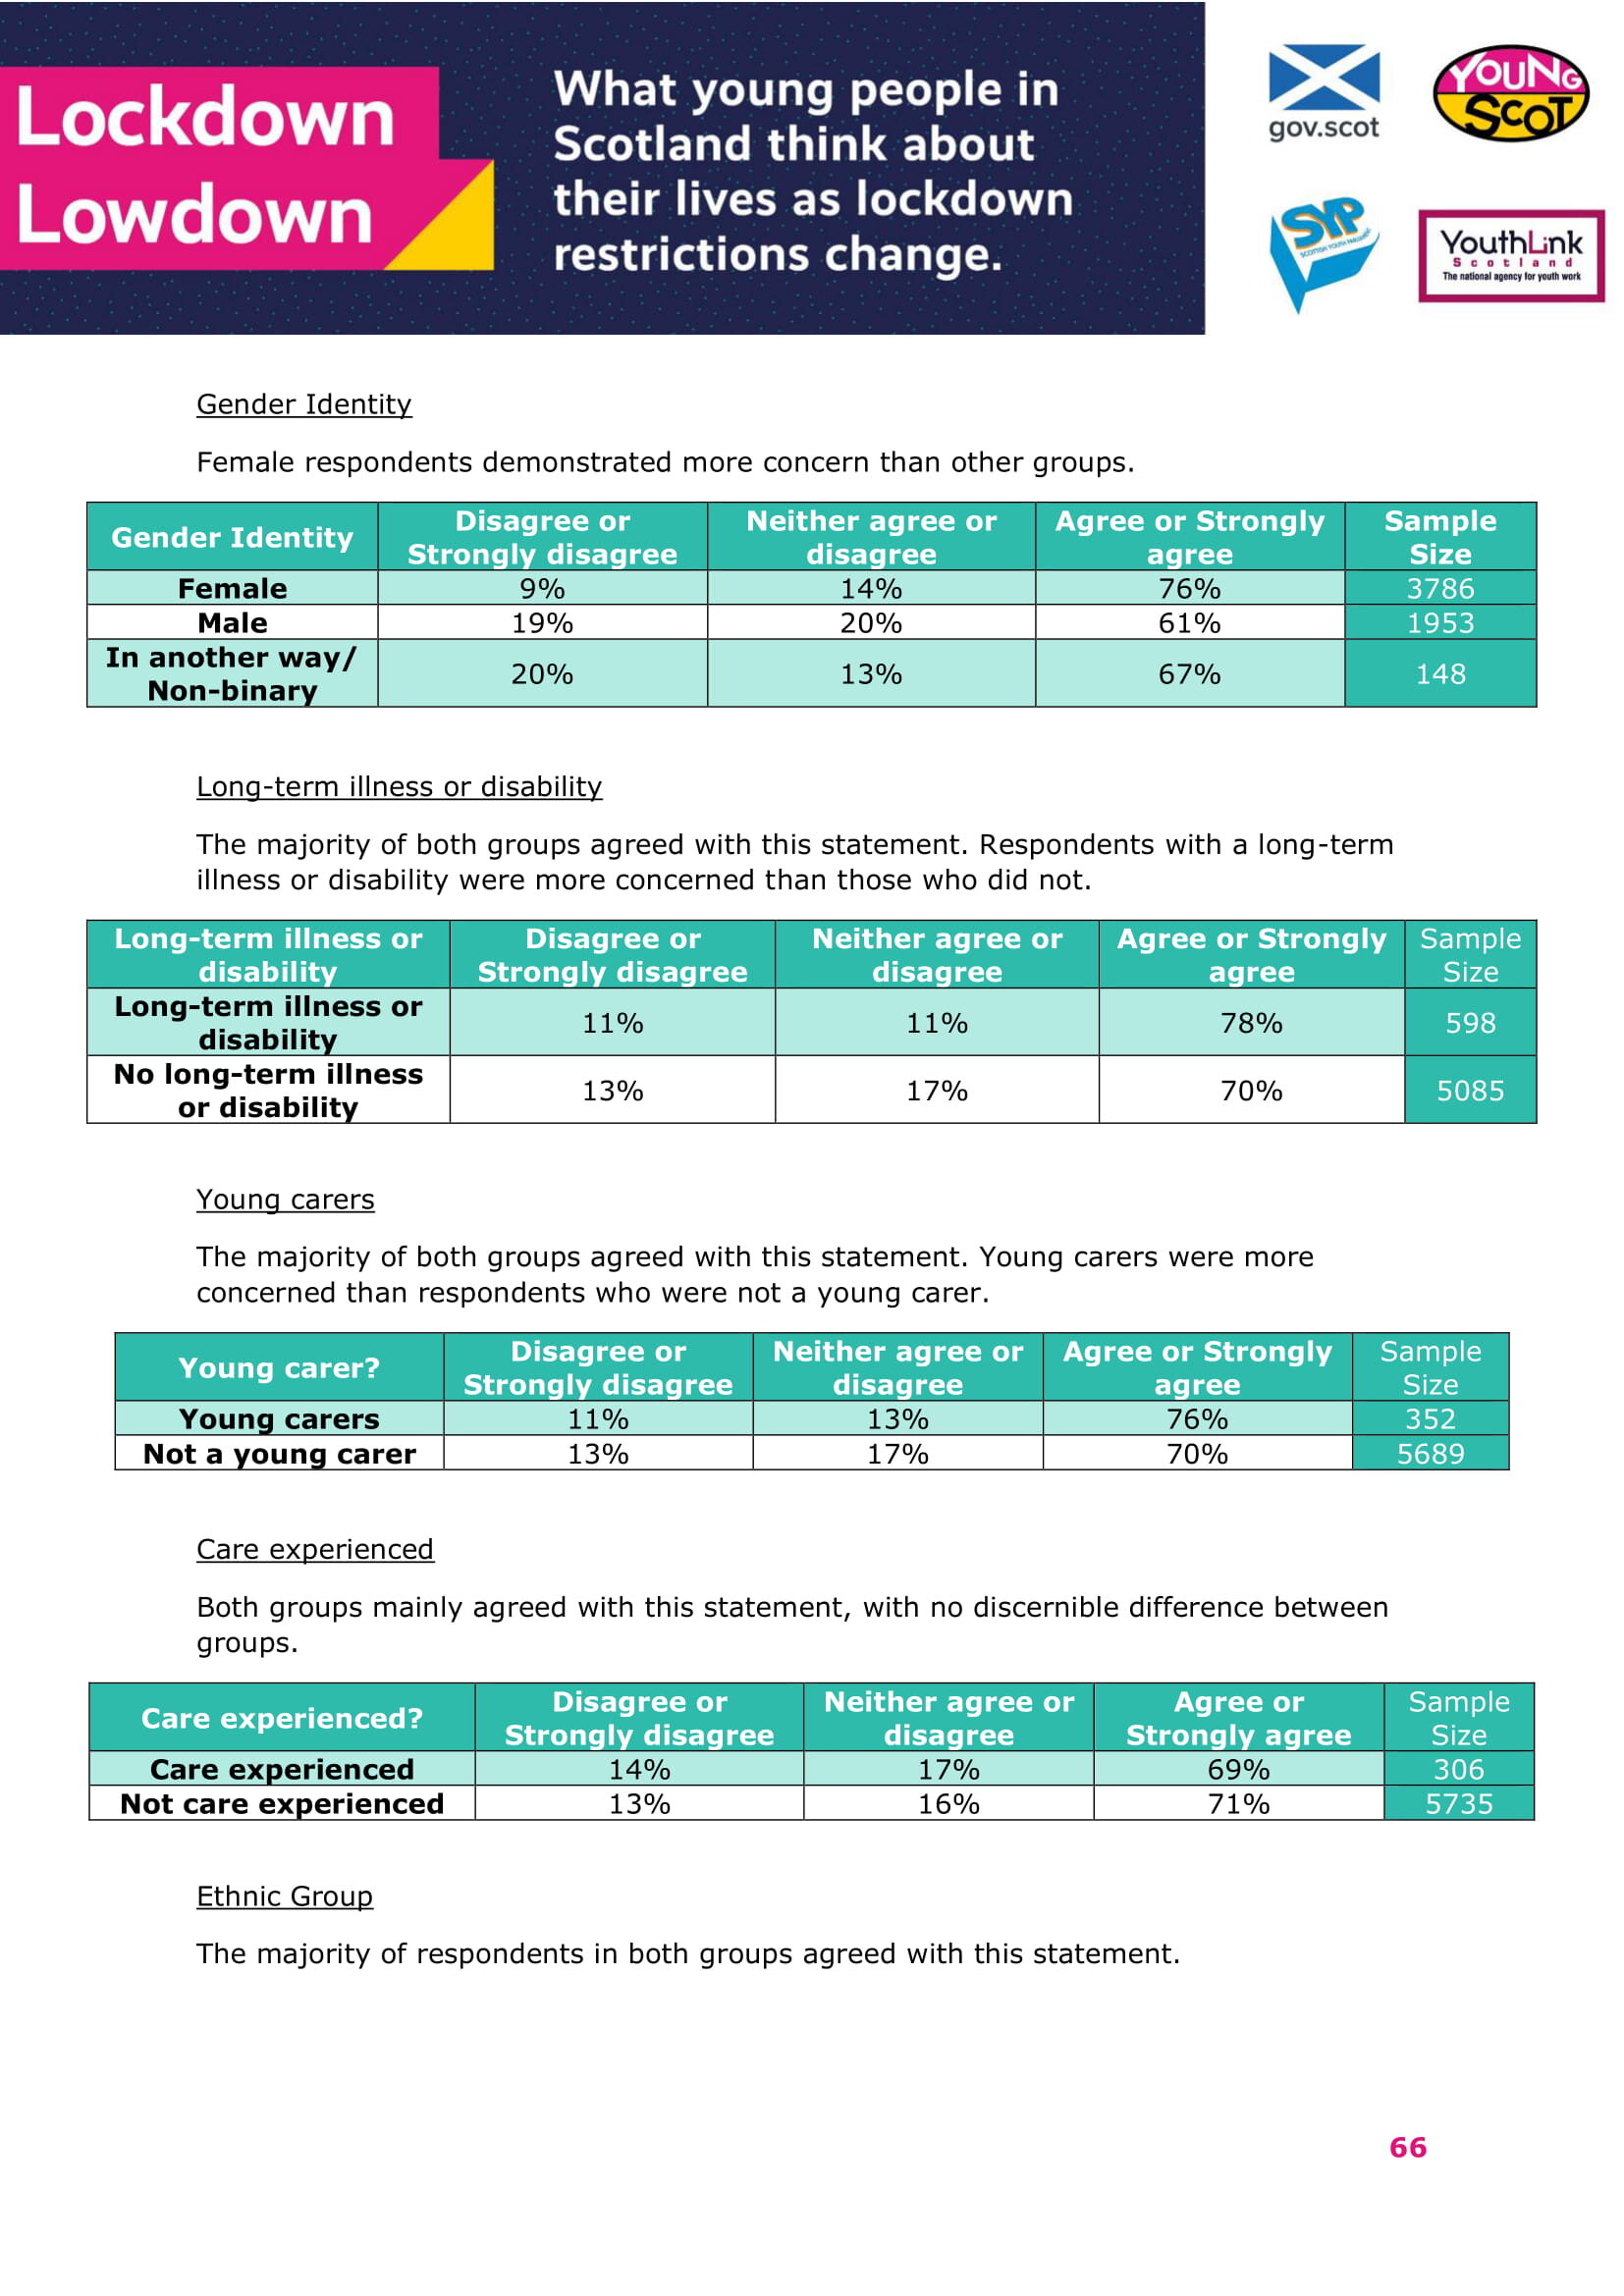
• Female respondents were more likely to be concerned about a second wave of the virus than the other groups (76% agreed that they were concerned compared with 61% of males and 67% who identified as non-binary or in another way).
• Female respondents were more likely to be concerned about transmitting the virus to others than the other groups (69% agreed that they were concerned compared to 56% of males and 59% who identified as non-binary or in another way).
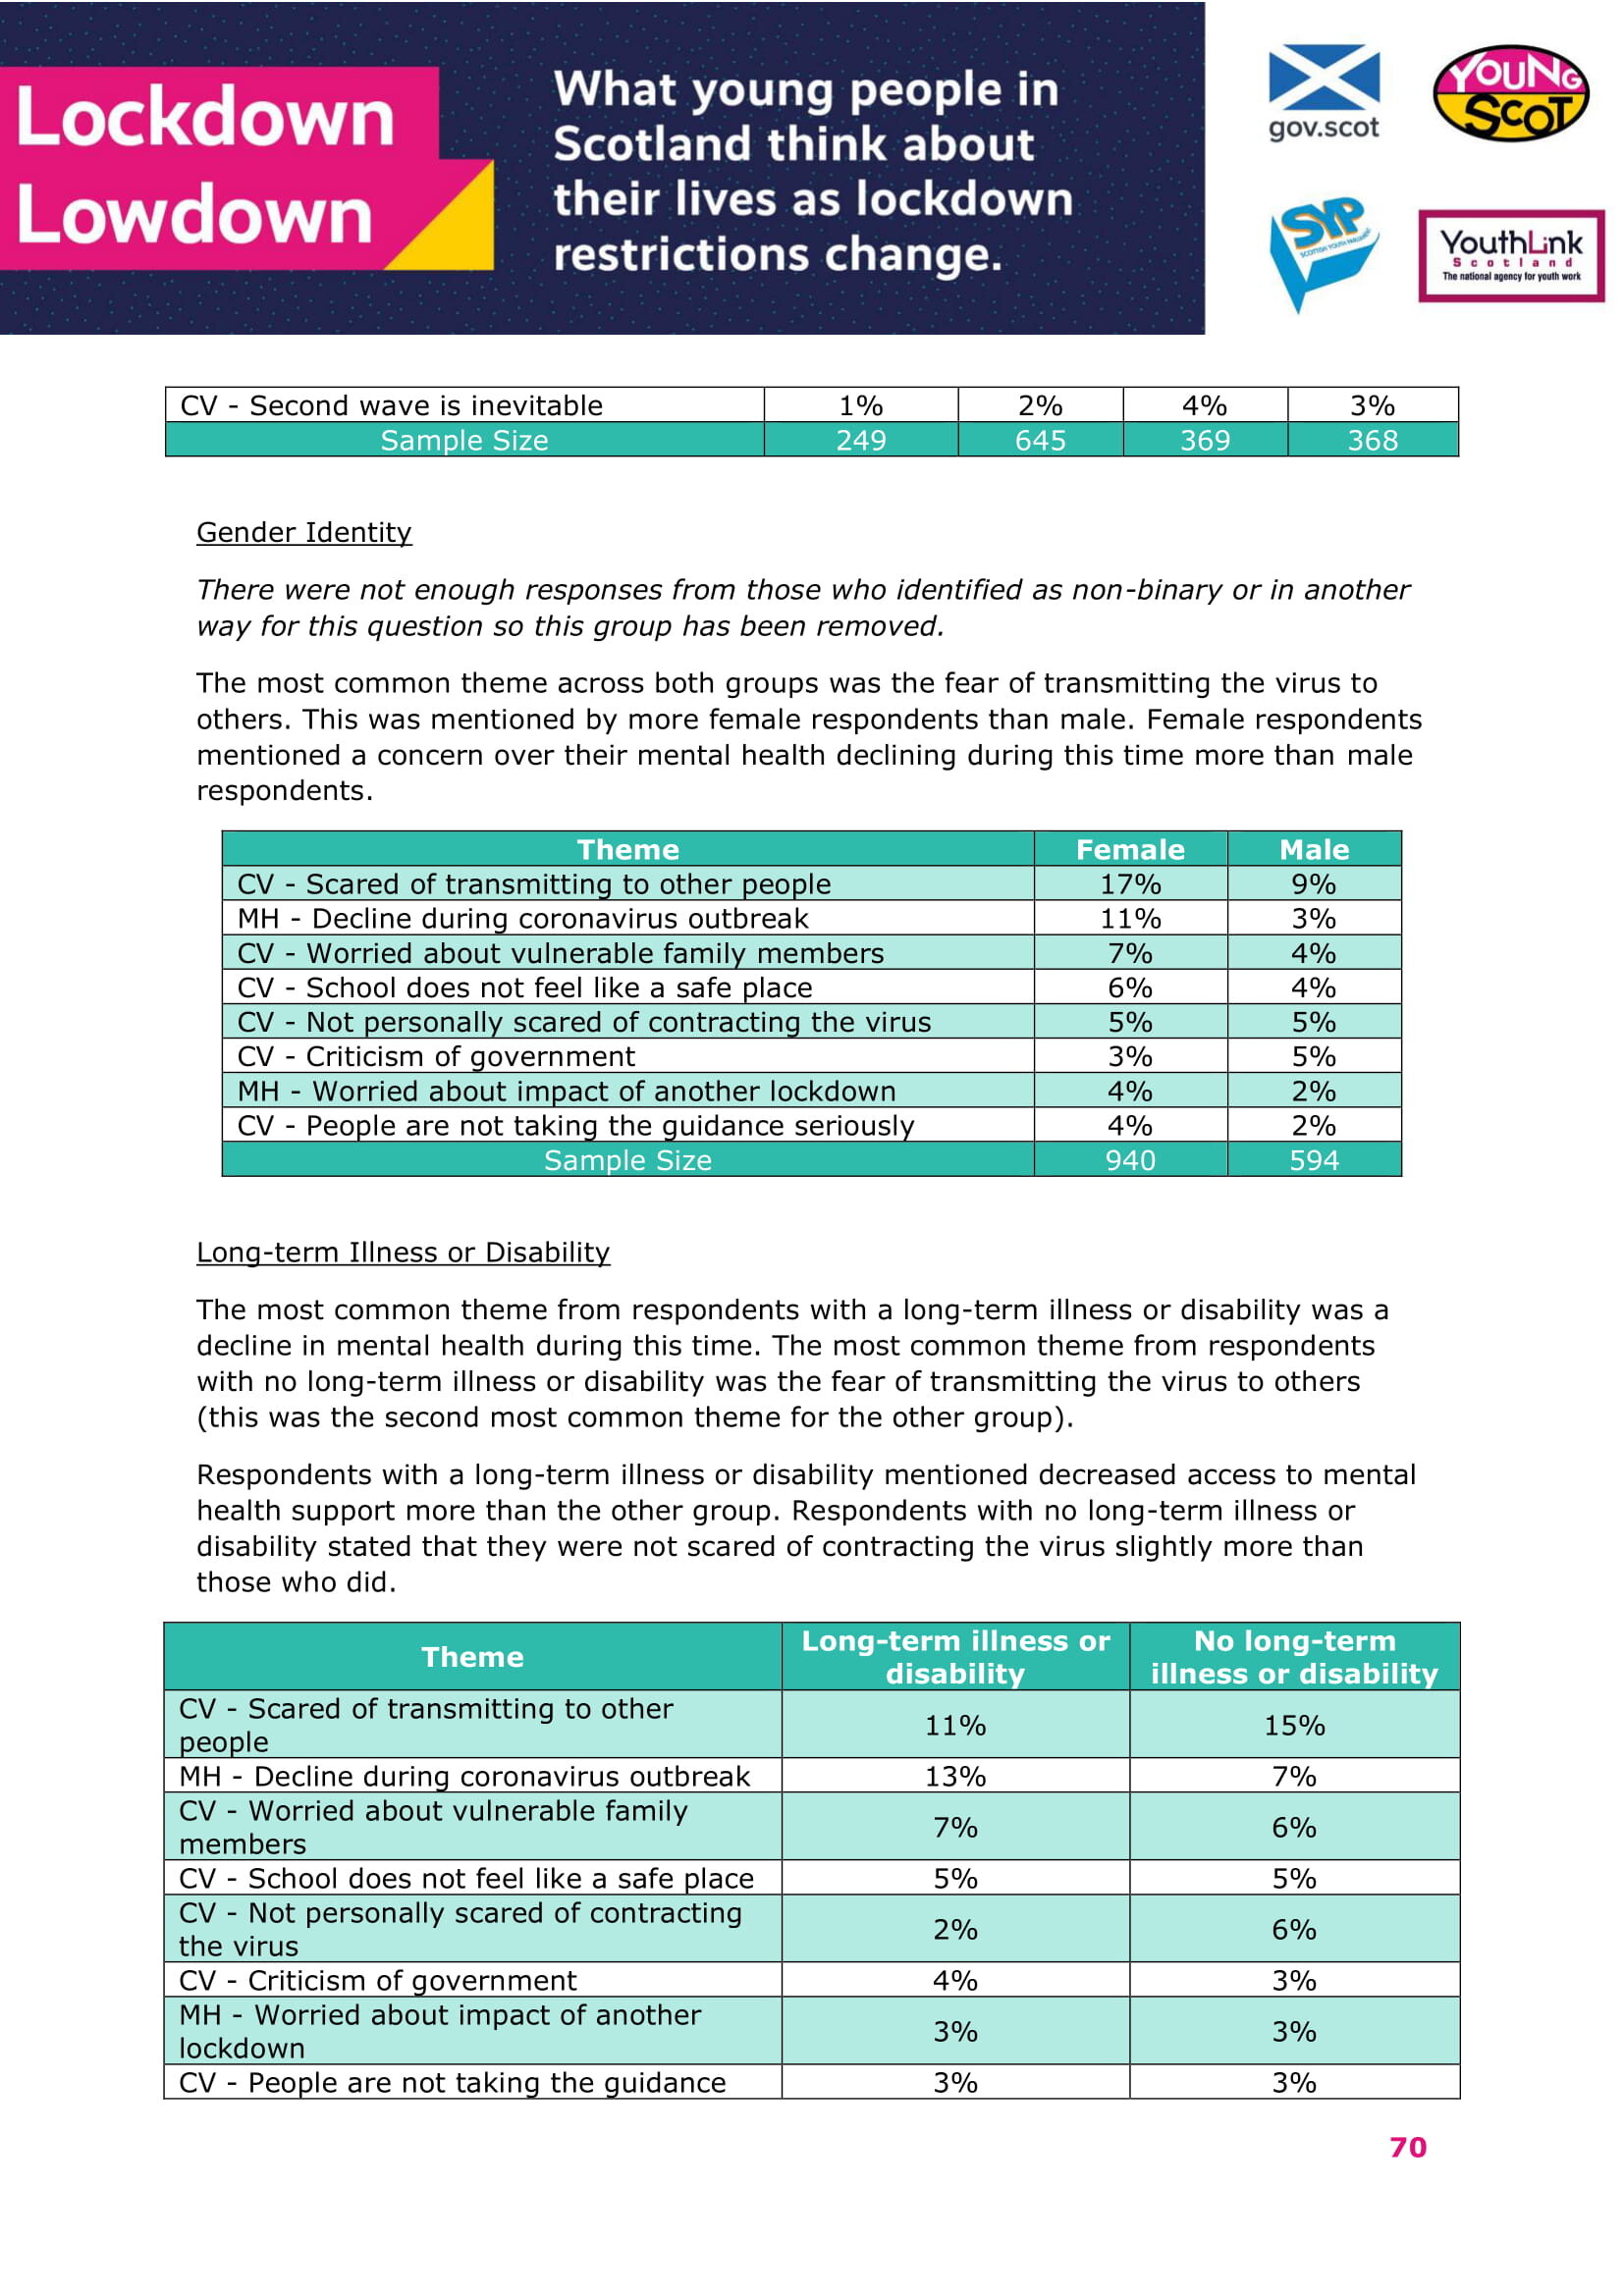
• When asked for further thoughts, female respondents mentioned a decline in mental health during the outbreak more than male respondents. This was a qualitative question with fewer responses compared to others.
Access to information
• Female respondents and those who identified as non-binary or in another way mostly stated that they knew the rules in general but were not sure on the details (55% and 53%). Male respondents mostly stated that they knew what all of the current rules were (52%).
• The majority of all groups stated that they had access to a personal device that could connect online. Respondents who identified as non-binary or in another way were slightly less likely to have access compared with other groups (91% compared with 98% of female respondents and 97% of male respondents).
• The majority of all groups stated that they had access to a device within their local community that could connect online. Respondents who identified as non-binary or in another way were slightly likely to have access compared with other groups (73% compared with 85% of female respondents and 89% of male respondents).
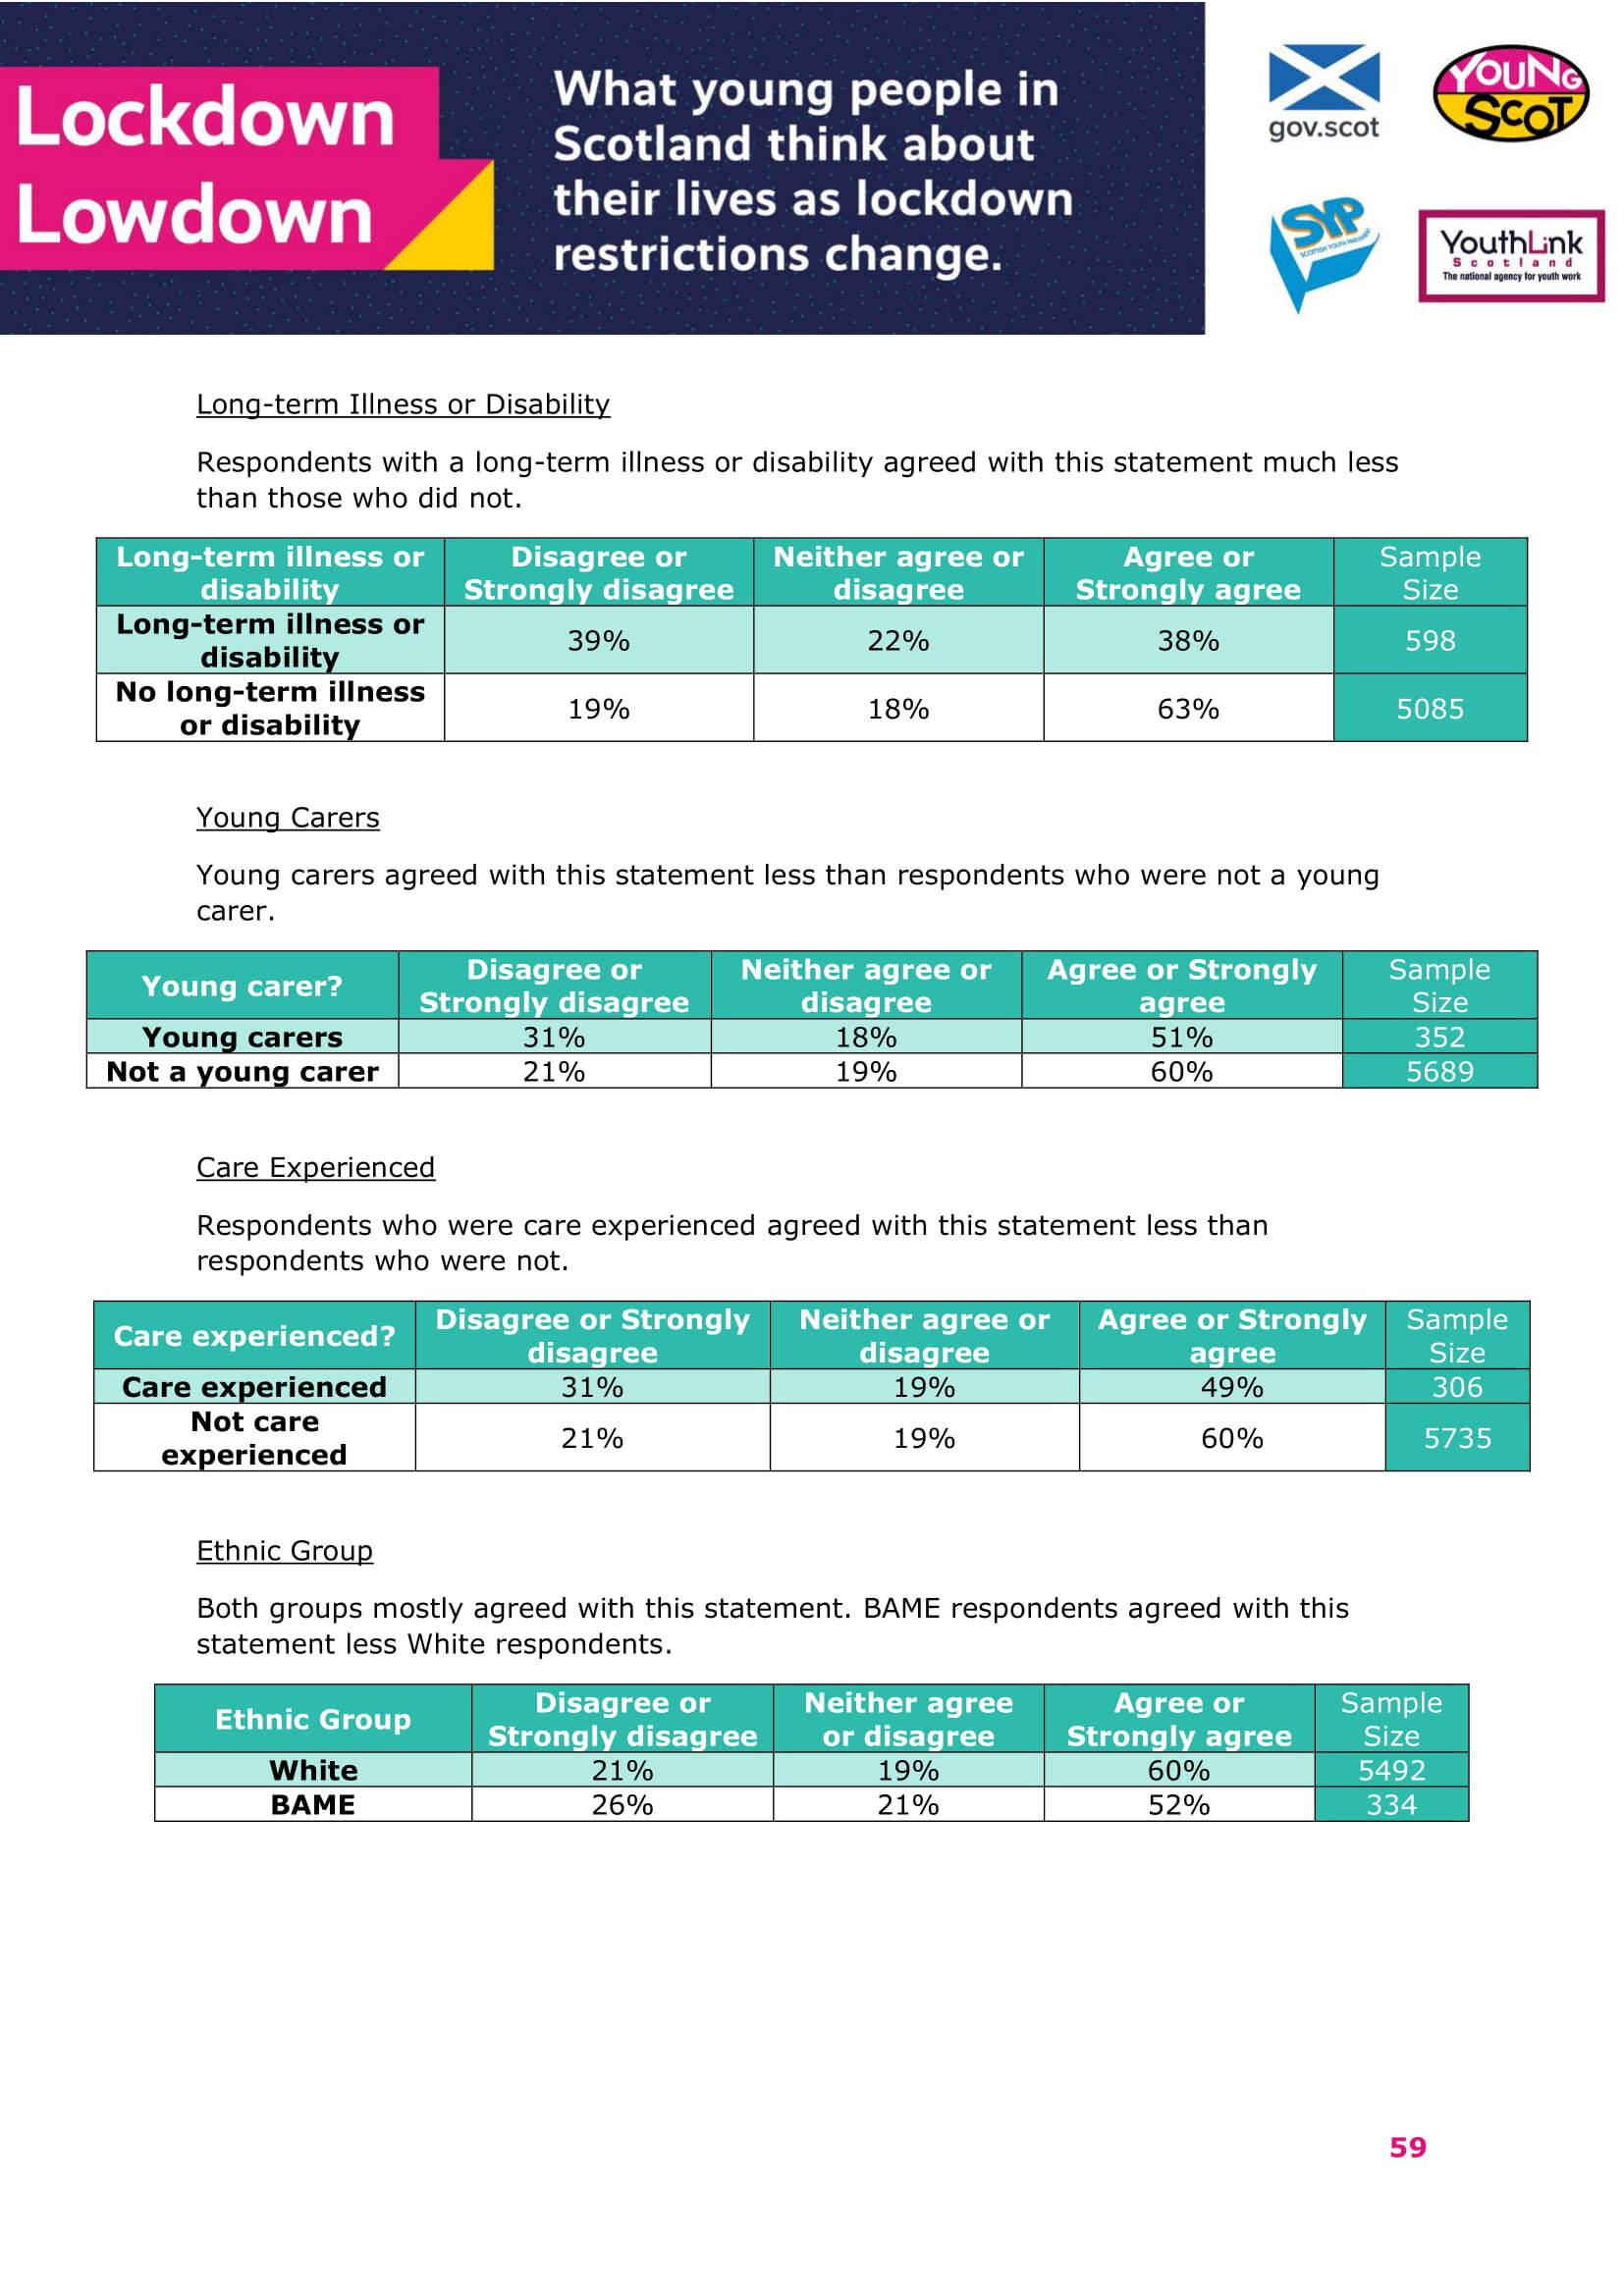
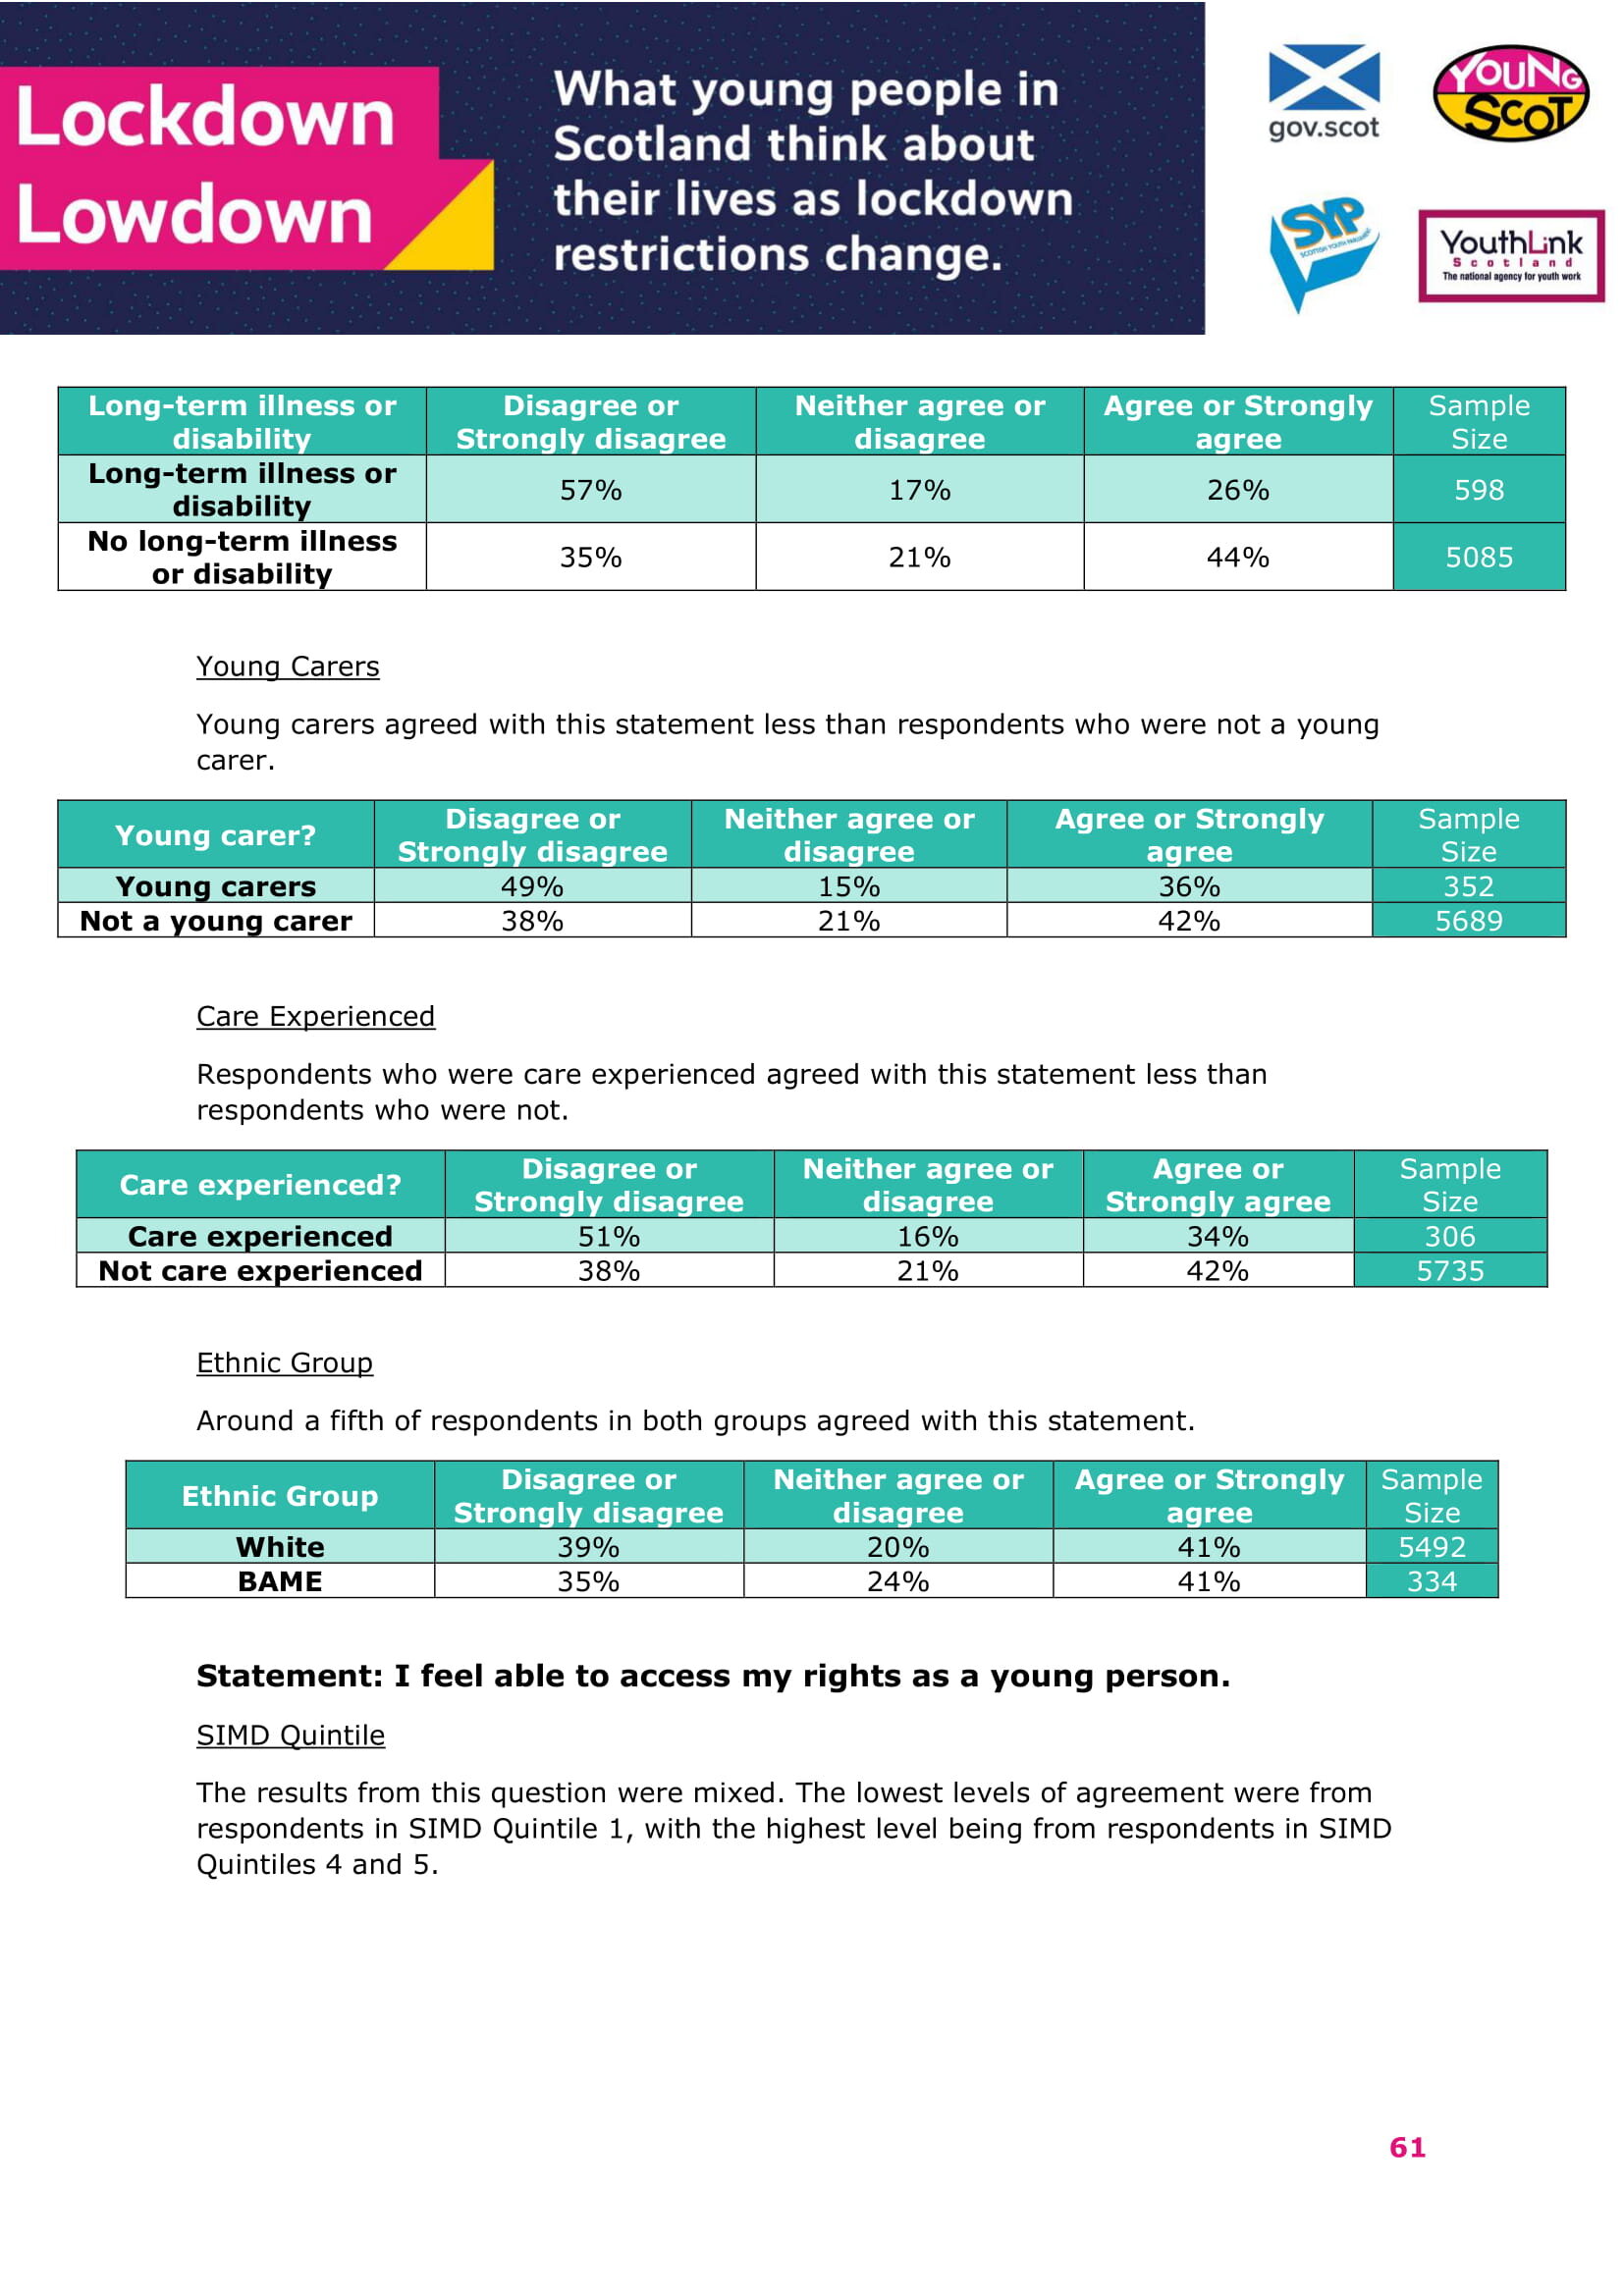
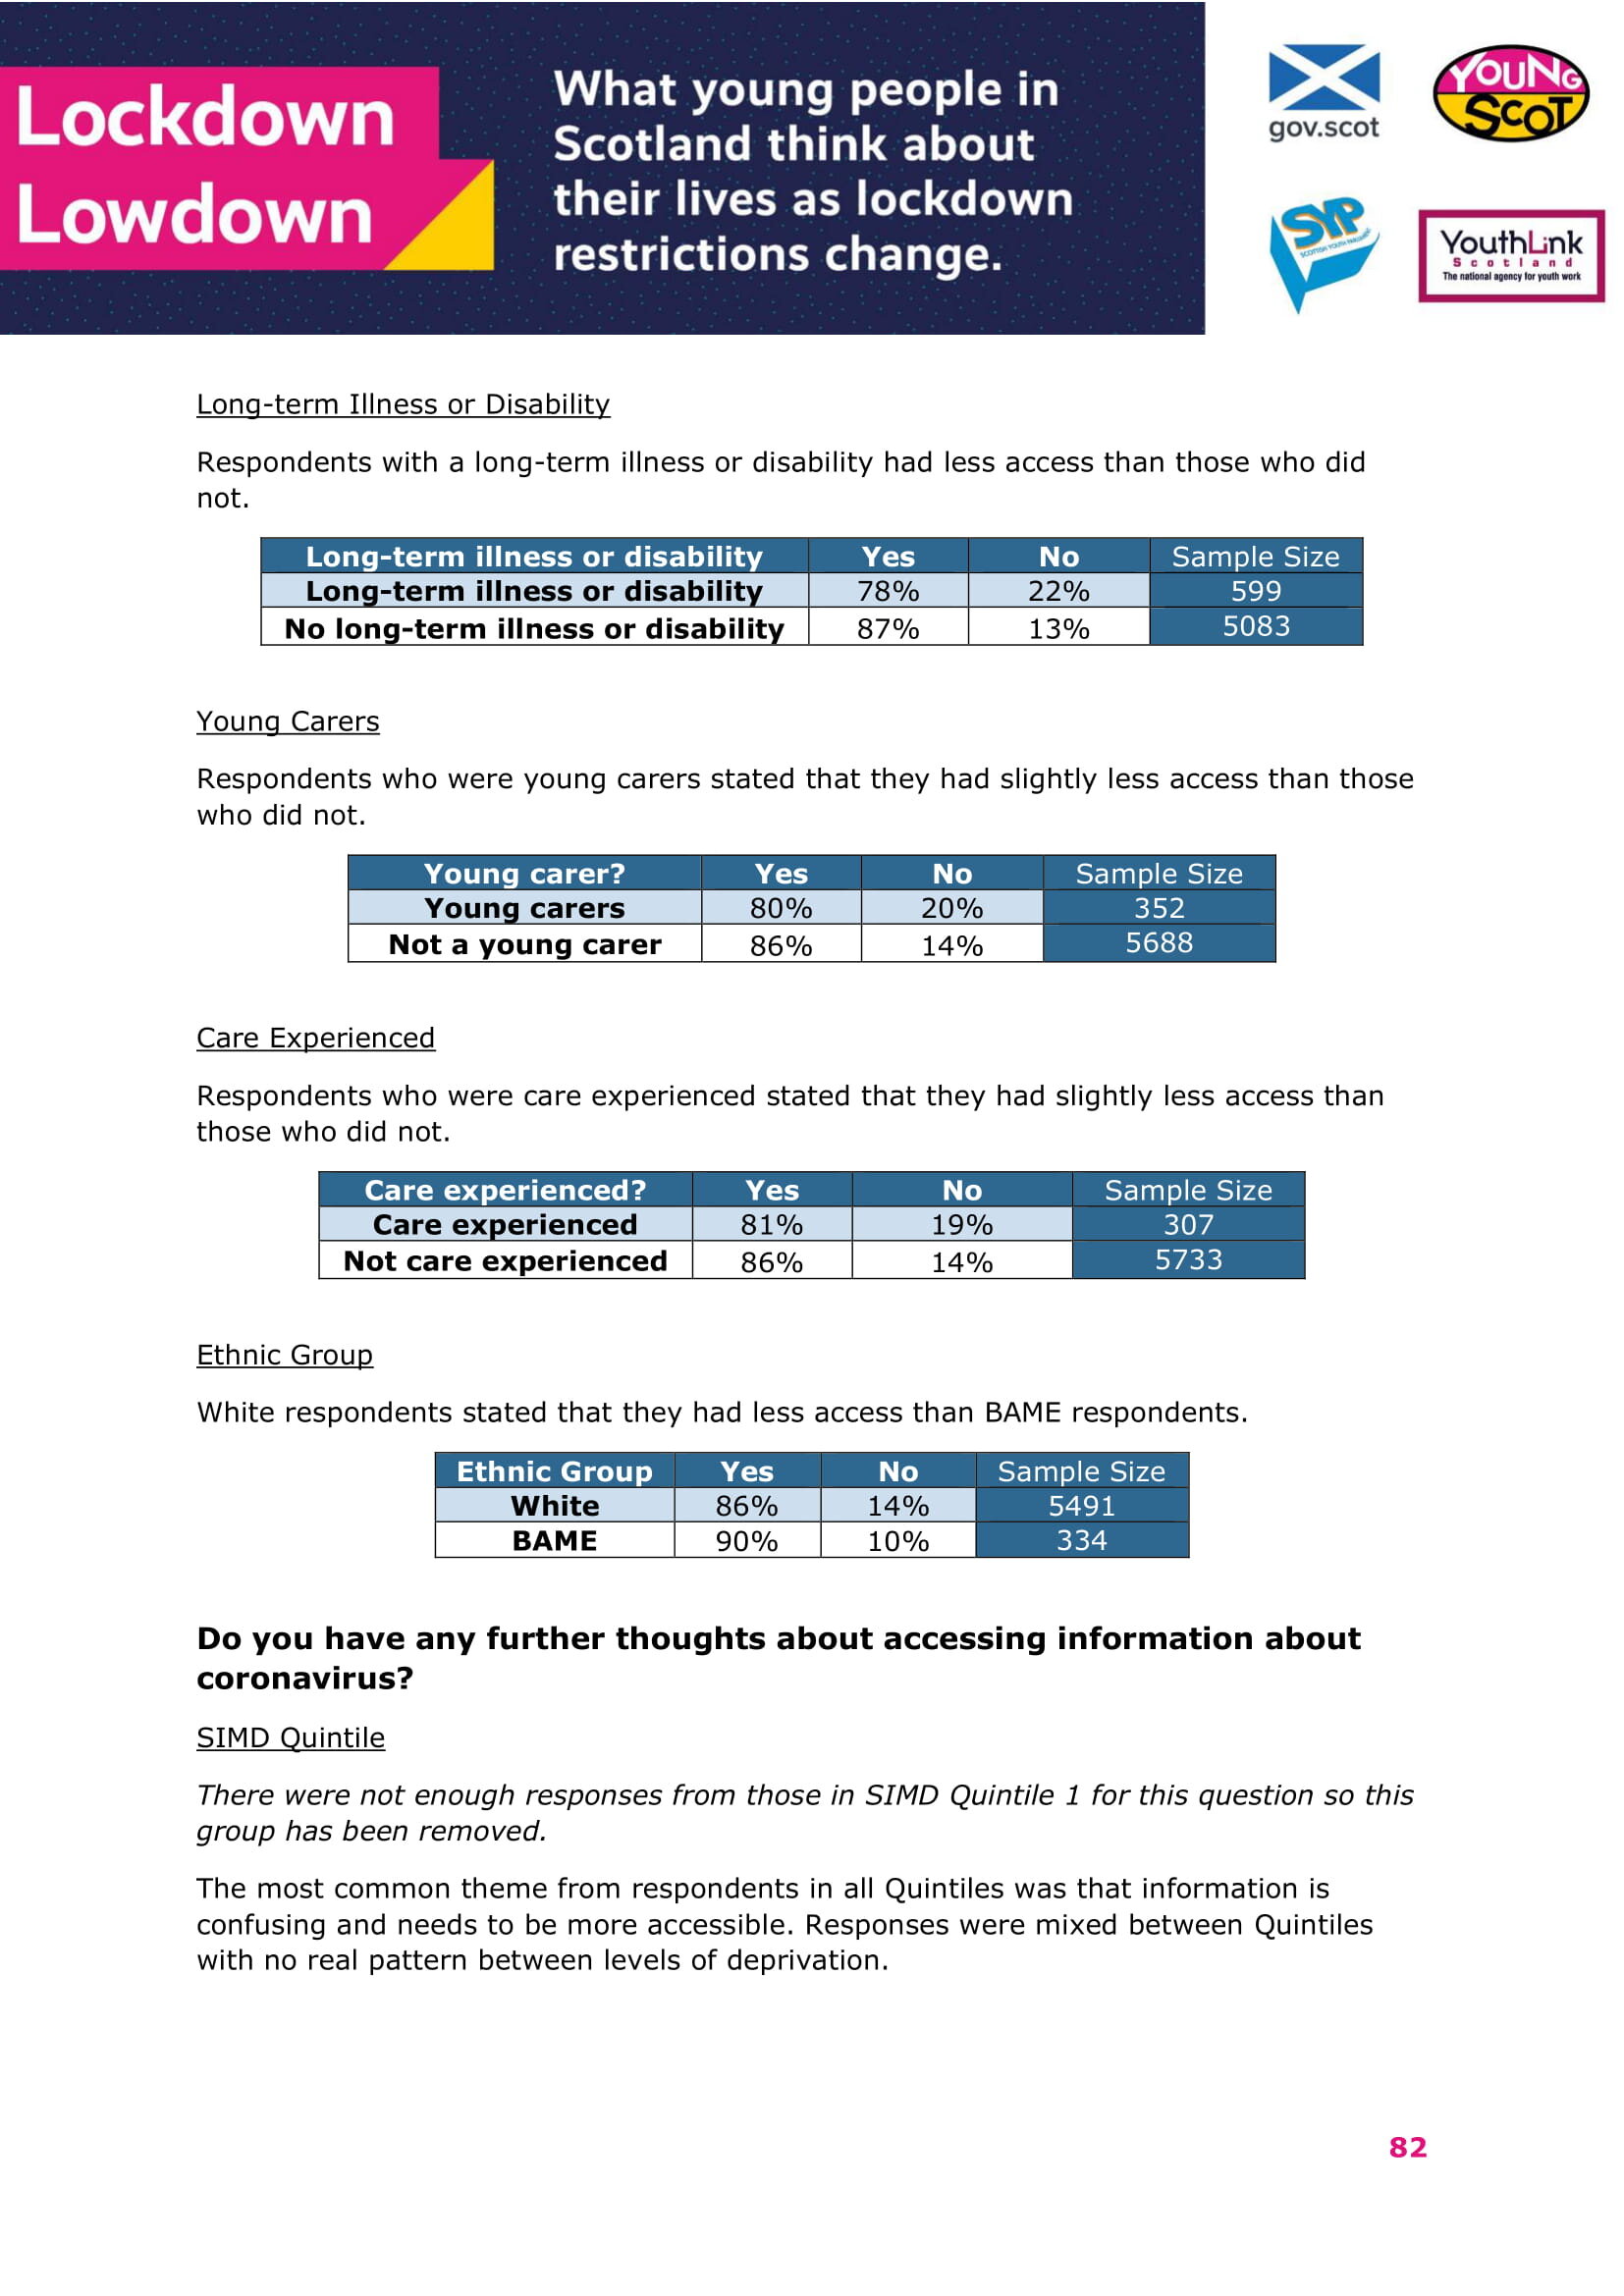
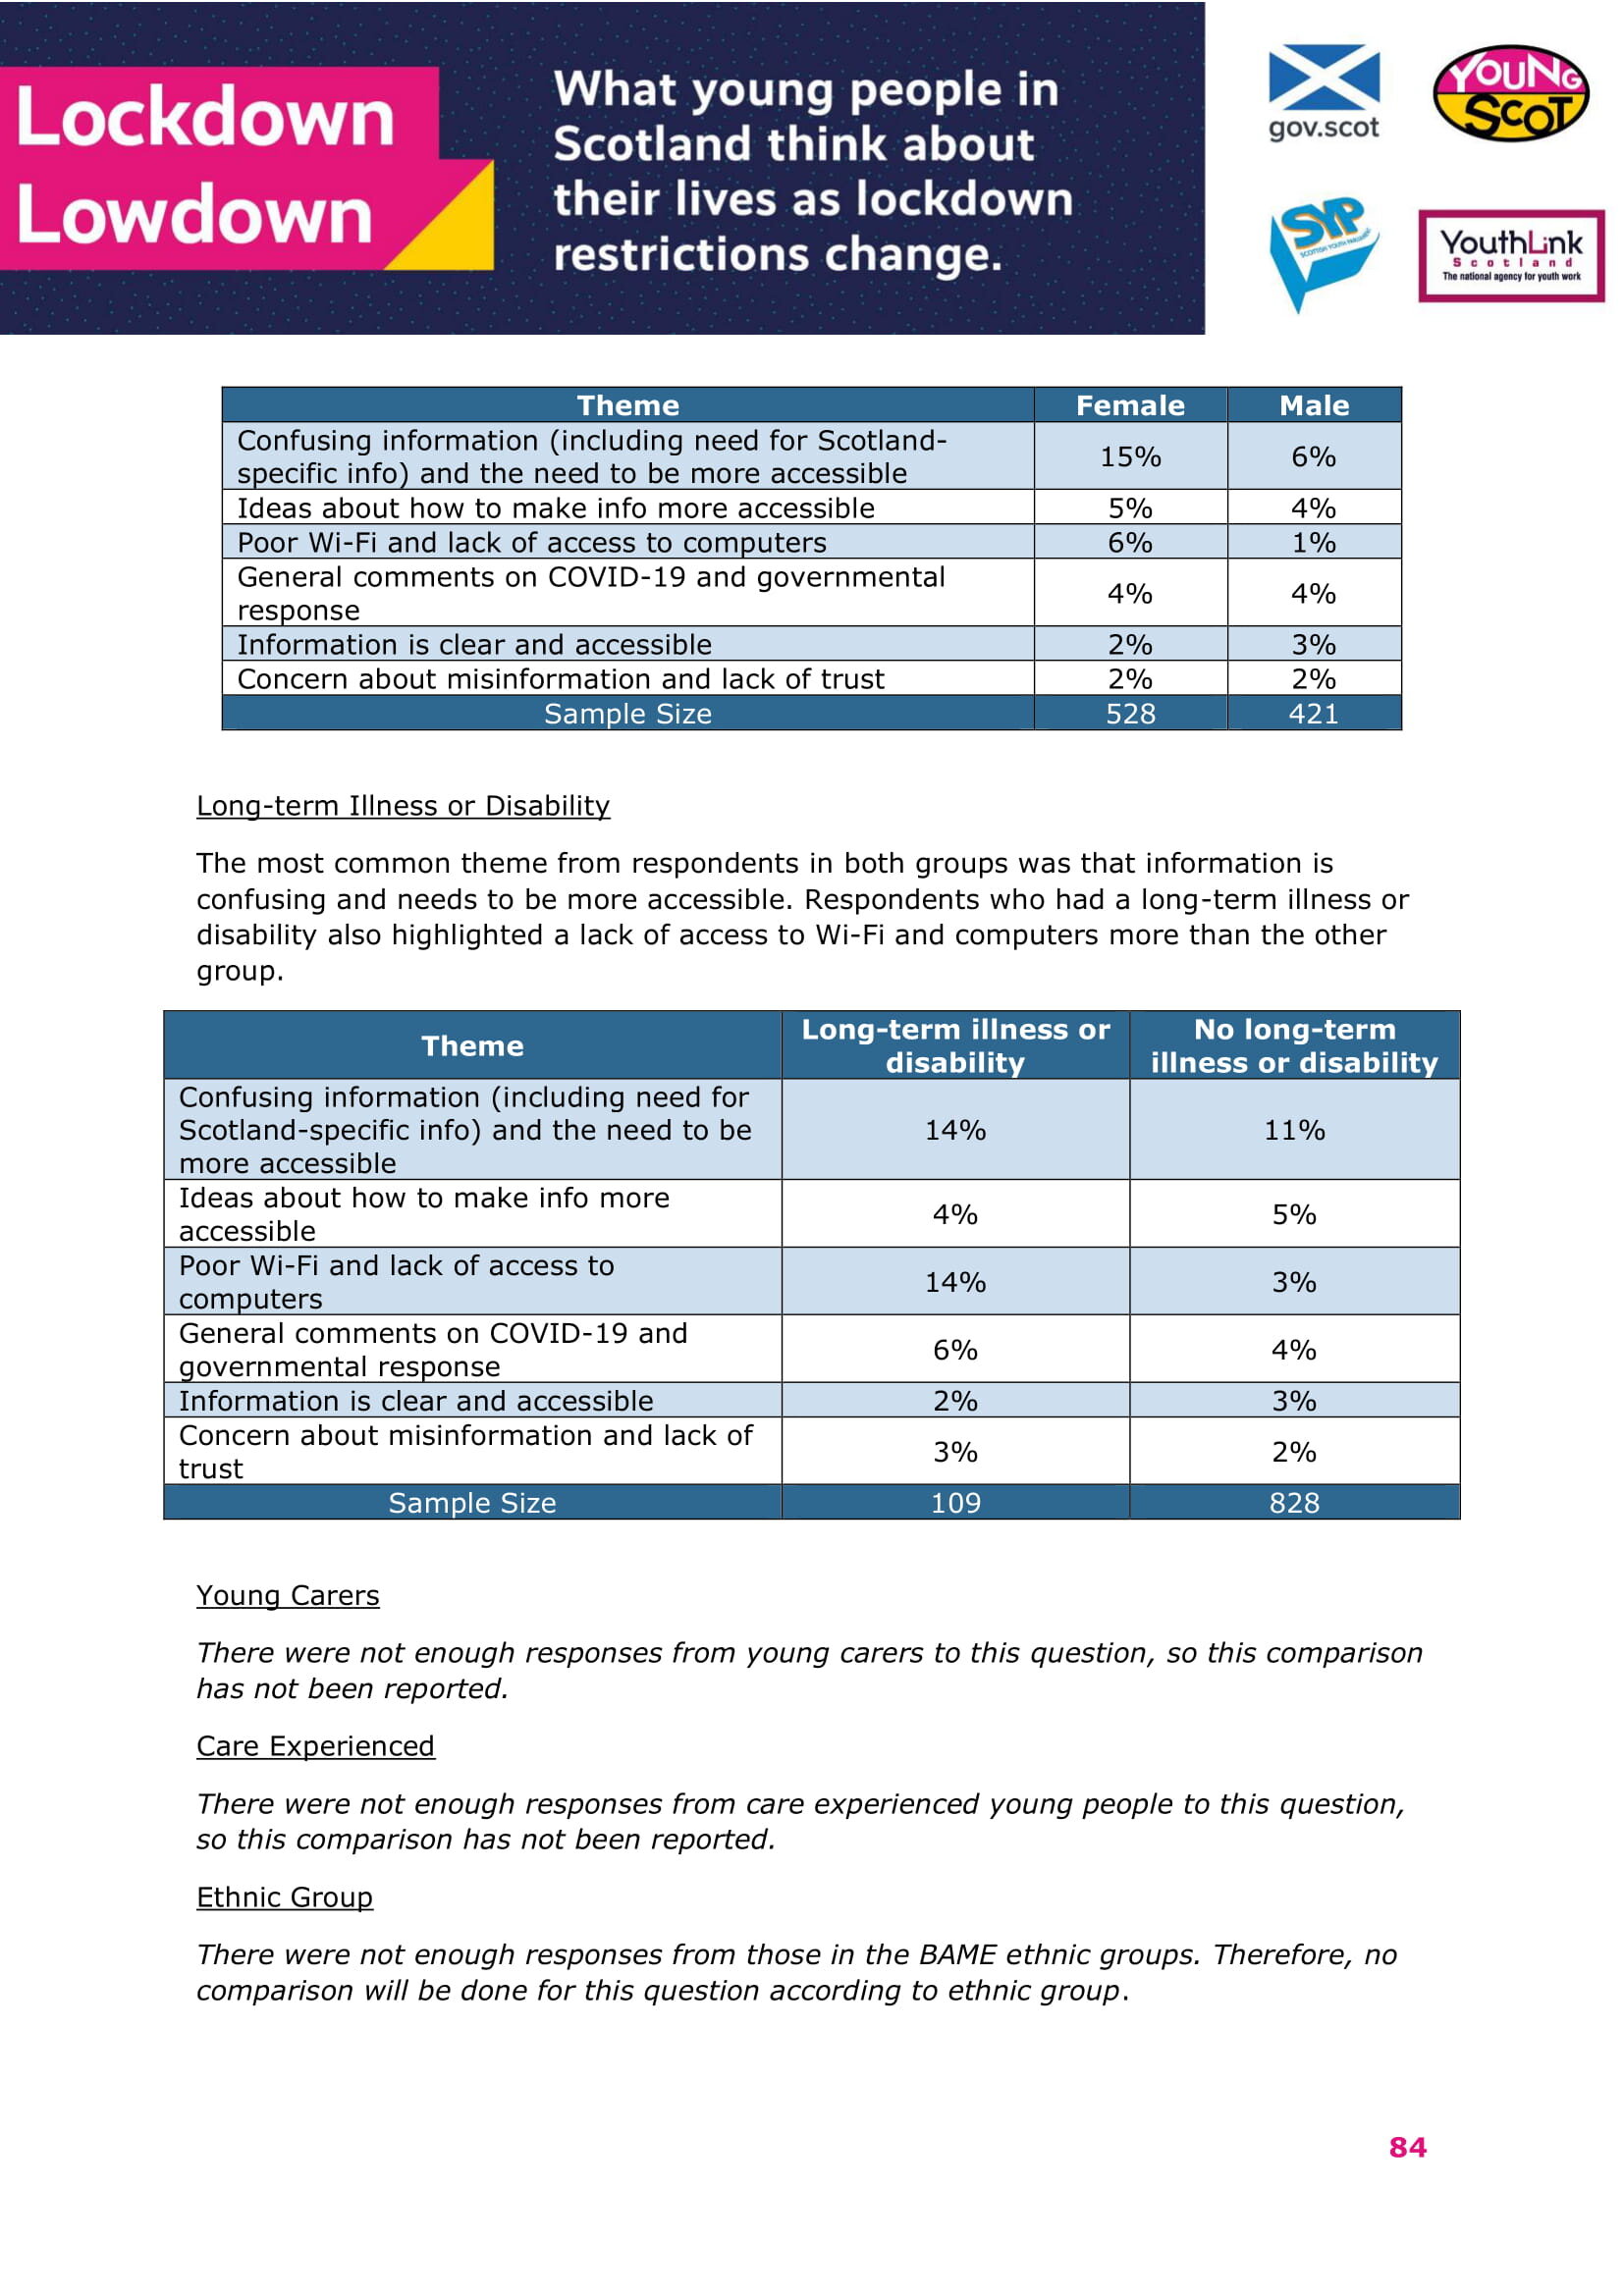
Key Findings: Long-term Illness or Disability
There were 599 respondents who identified as having a long-term illness or disability expected to last at least 12 months. 5,085 respondents selected No, 354 selected I prefer not to say and five respondents left the box blank.
Impact of coronavirus on education
• When respondents were asked if they were happy about the current arrangements for their educational course, respondents who had a long-term illness or disability were less likely to agree with this statement than those who did not (68% of respondents who had a long-term illness or disability selected Yes compared with 77% of those who did not).
• When asked if there was anything that they would like to change about their current arrangements, the most common theme for respondents who had a long-term illness or disability was a preference for learning in person. For respondents who did not have a long-term illness or disability, the most common theme was an enforcement or increase in social distancing within educational establishments. This was a qualitative question with fewer responses compared to others.
• For those who had returned to in-person learning, respondents who had a long-term illness or disability were less likely to agree that they were happy to be back than those who did not. (60% of respondents who had a long-term illness or disability compared with 68% of those who did not).
• When asked if their educational establishment had re-opened in a safe way, respondents who had a long-term illness or disability were less likely to agree with this statement than those who did not (56% of respondents who had a long-term illness or disability compared with 64% of those who did not).
• When asked for any further thoughts on education, the most common theme for respondents who had a long-term illness or disability was expressing difficulties with online learning. For respondents with no long-term illness or disability, the most prominent theme was a concern over exams. This was a qualitative question with fewer responses compared to others.
Impact of coronavirus on relationships
• Respondents who had a long-term illness or disability were less likely to agree that they had a good relationship with their family and friends than those who did not (74% of respondents who had a long-term illness or disability compared with 85% of those who did not).
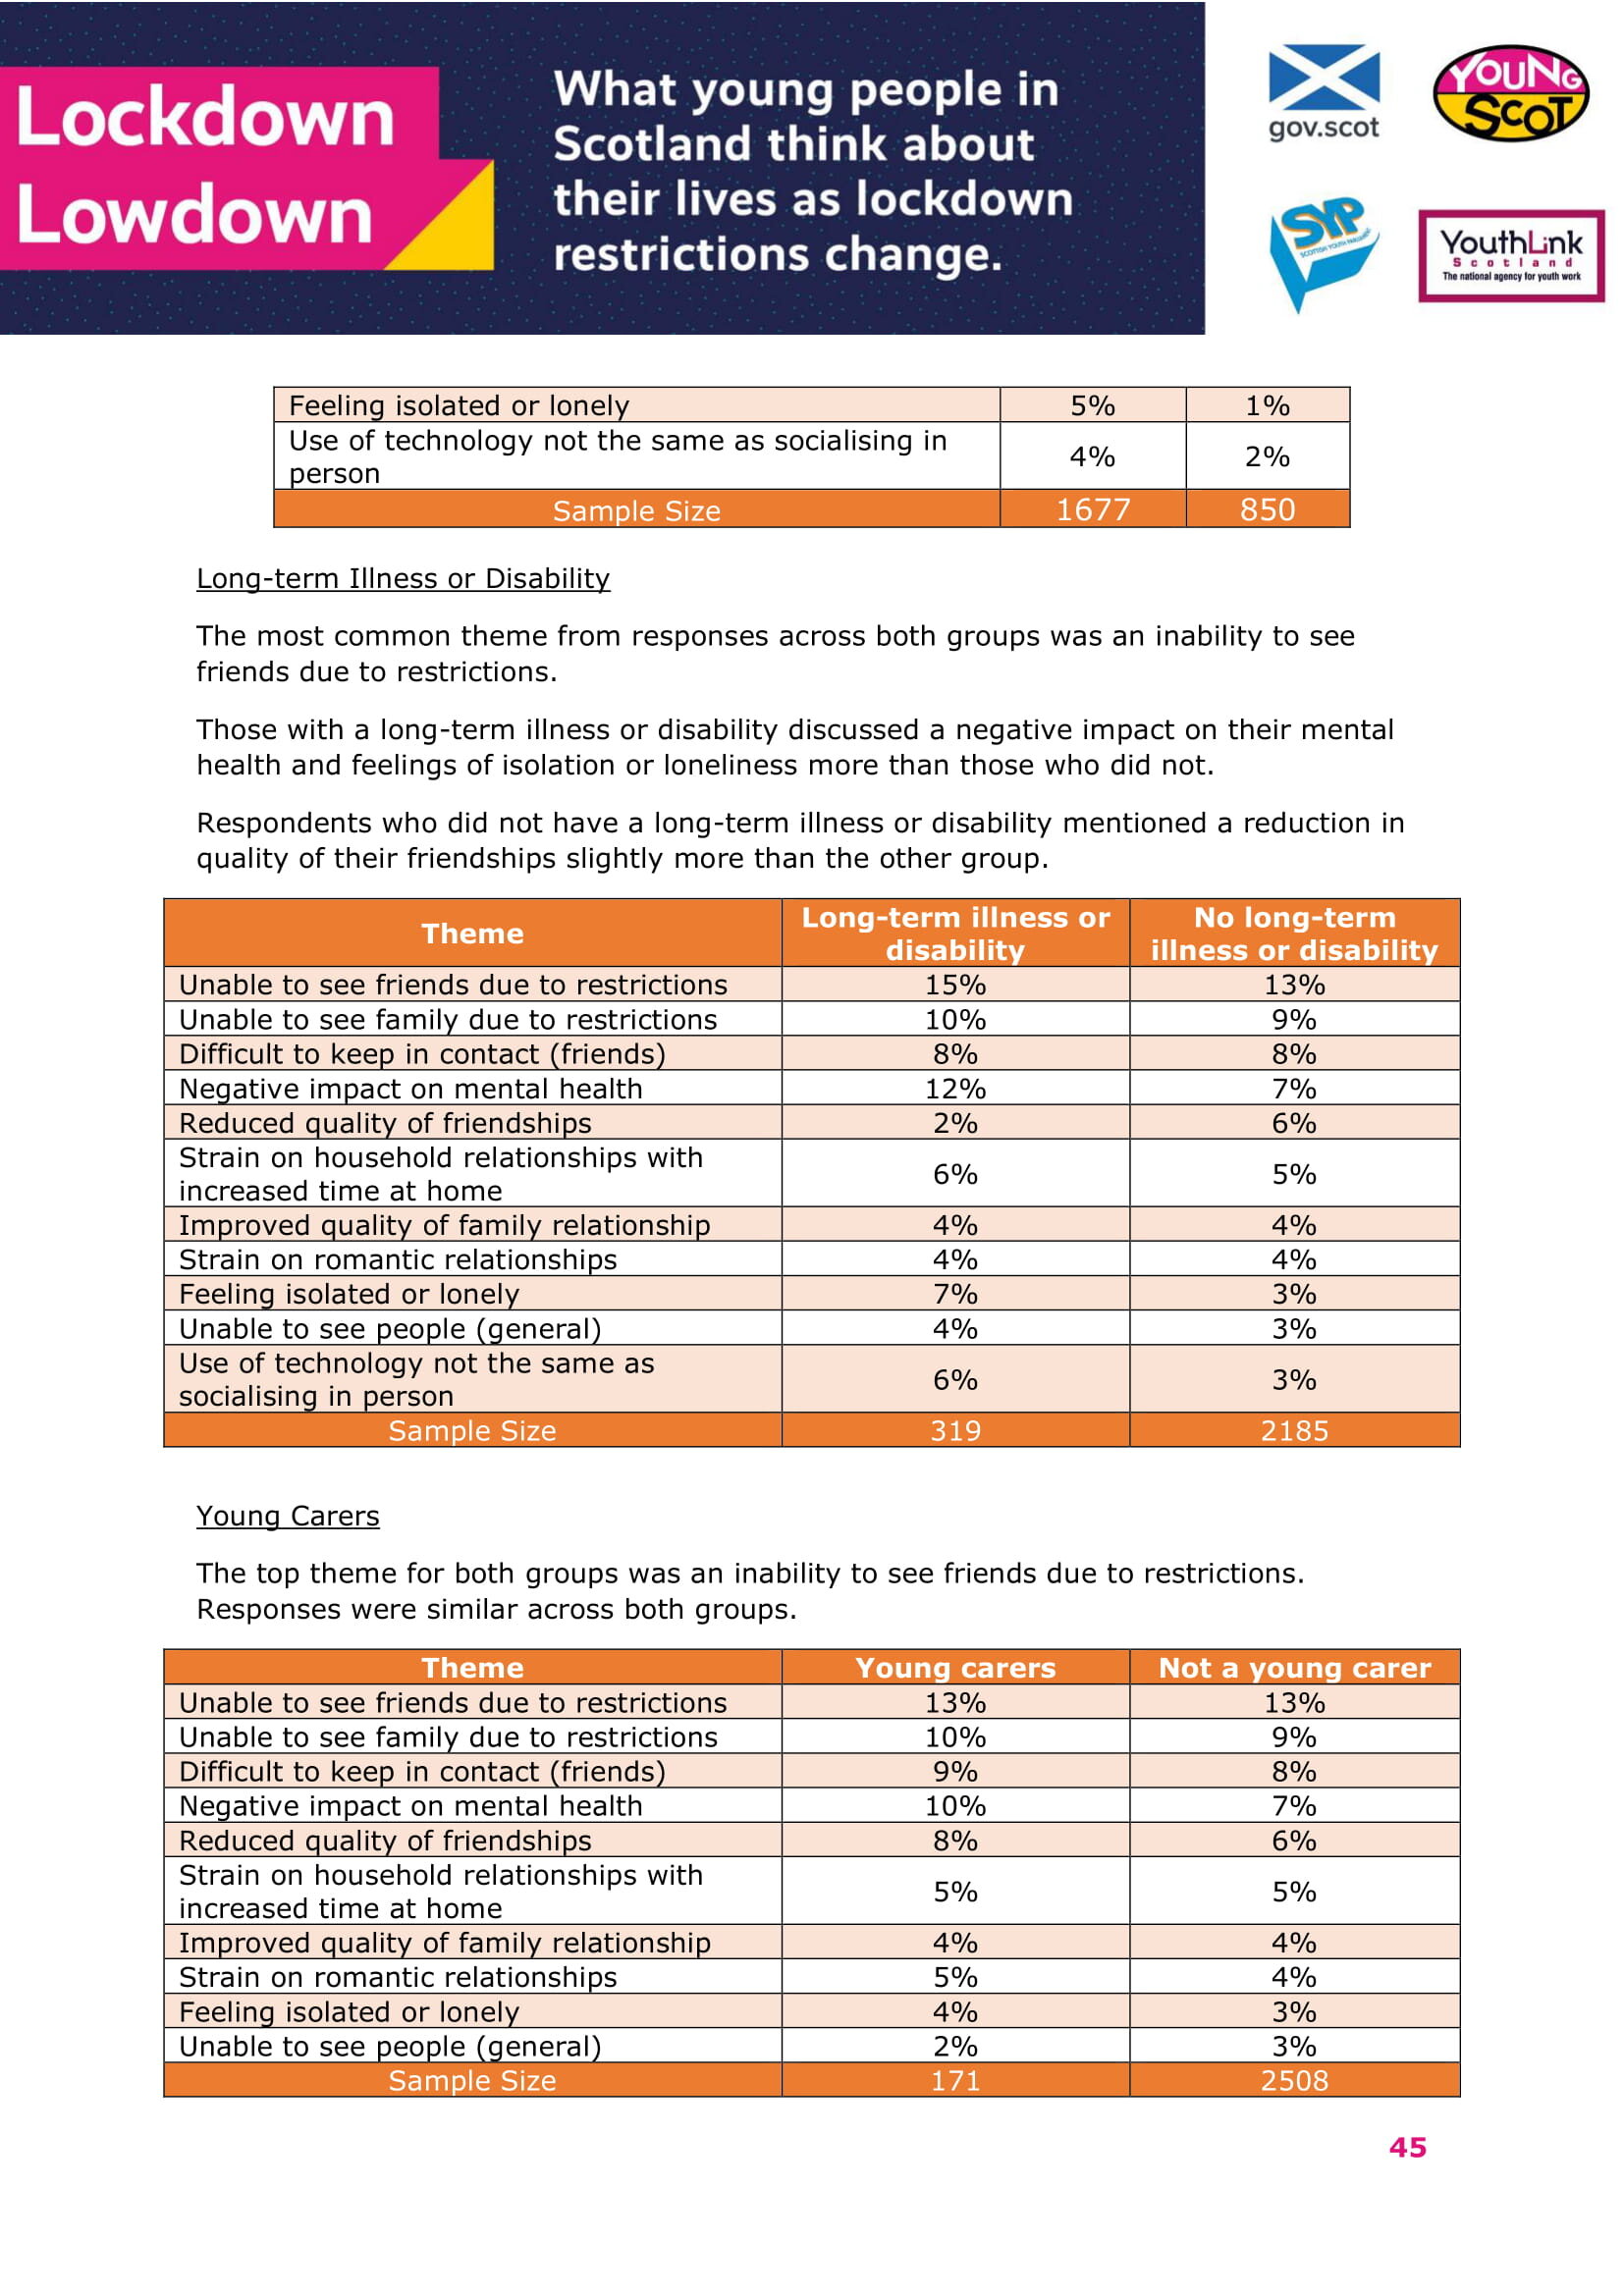
• When asked for any further thoughts on relationships, respondents who had a long-term illness or disability discussed a negative impact on their mental health and feelings of isolation or loneliness more than those who did not. This was a qualitative question with fewer responses compared to others.
Impact of coronavirus on employment
• Respondents who had a long-term illness or disability were less likely to agree that they felt good about their current employment prospects than those who did not (57% of respondents who had a long-term illness or disability compared with 49% of those who did not).
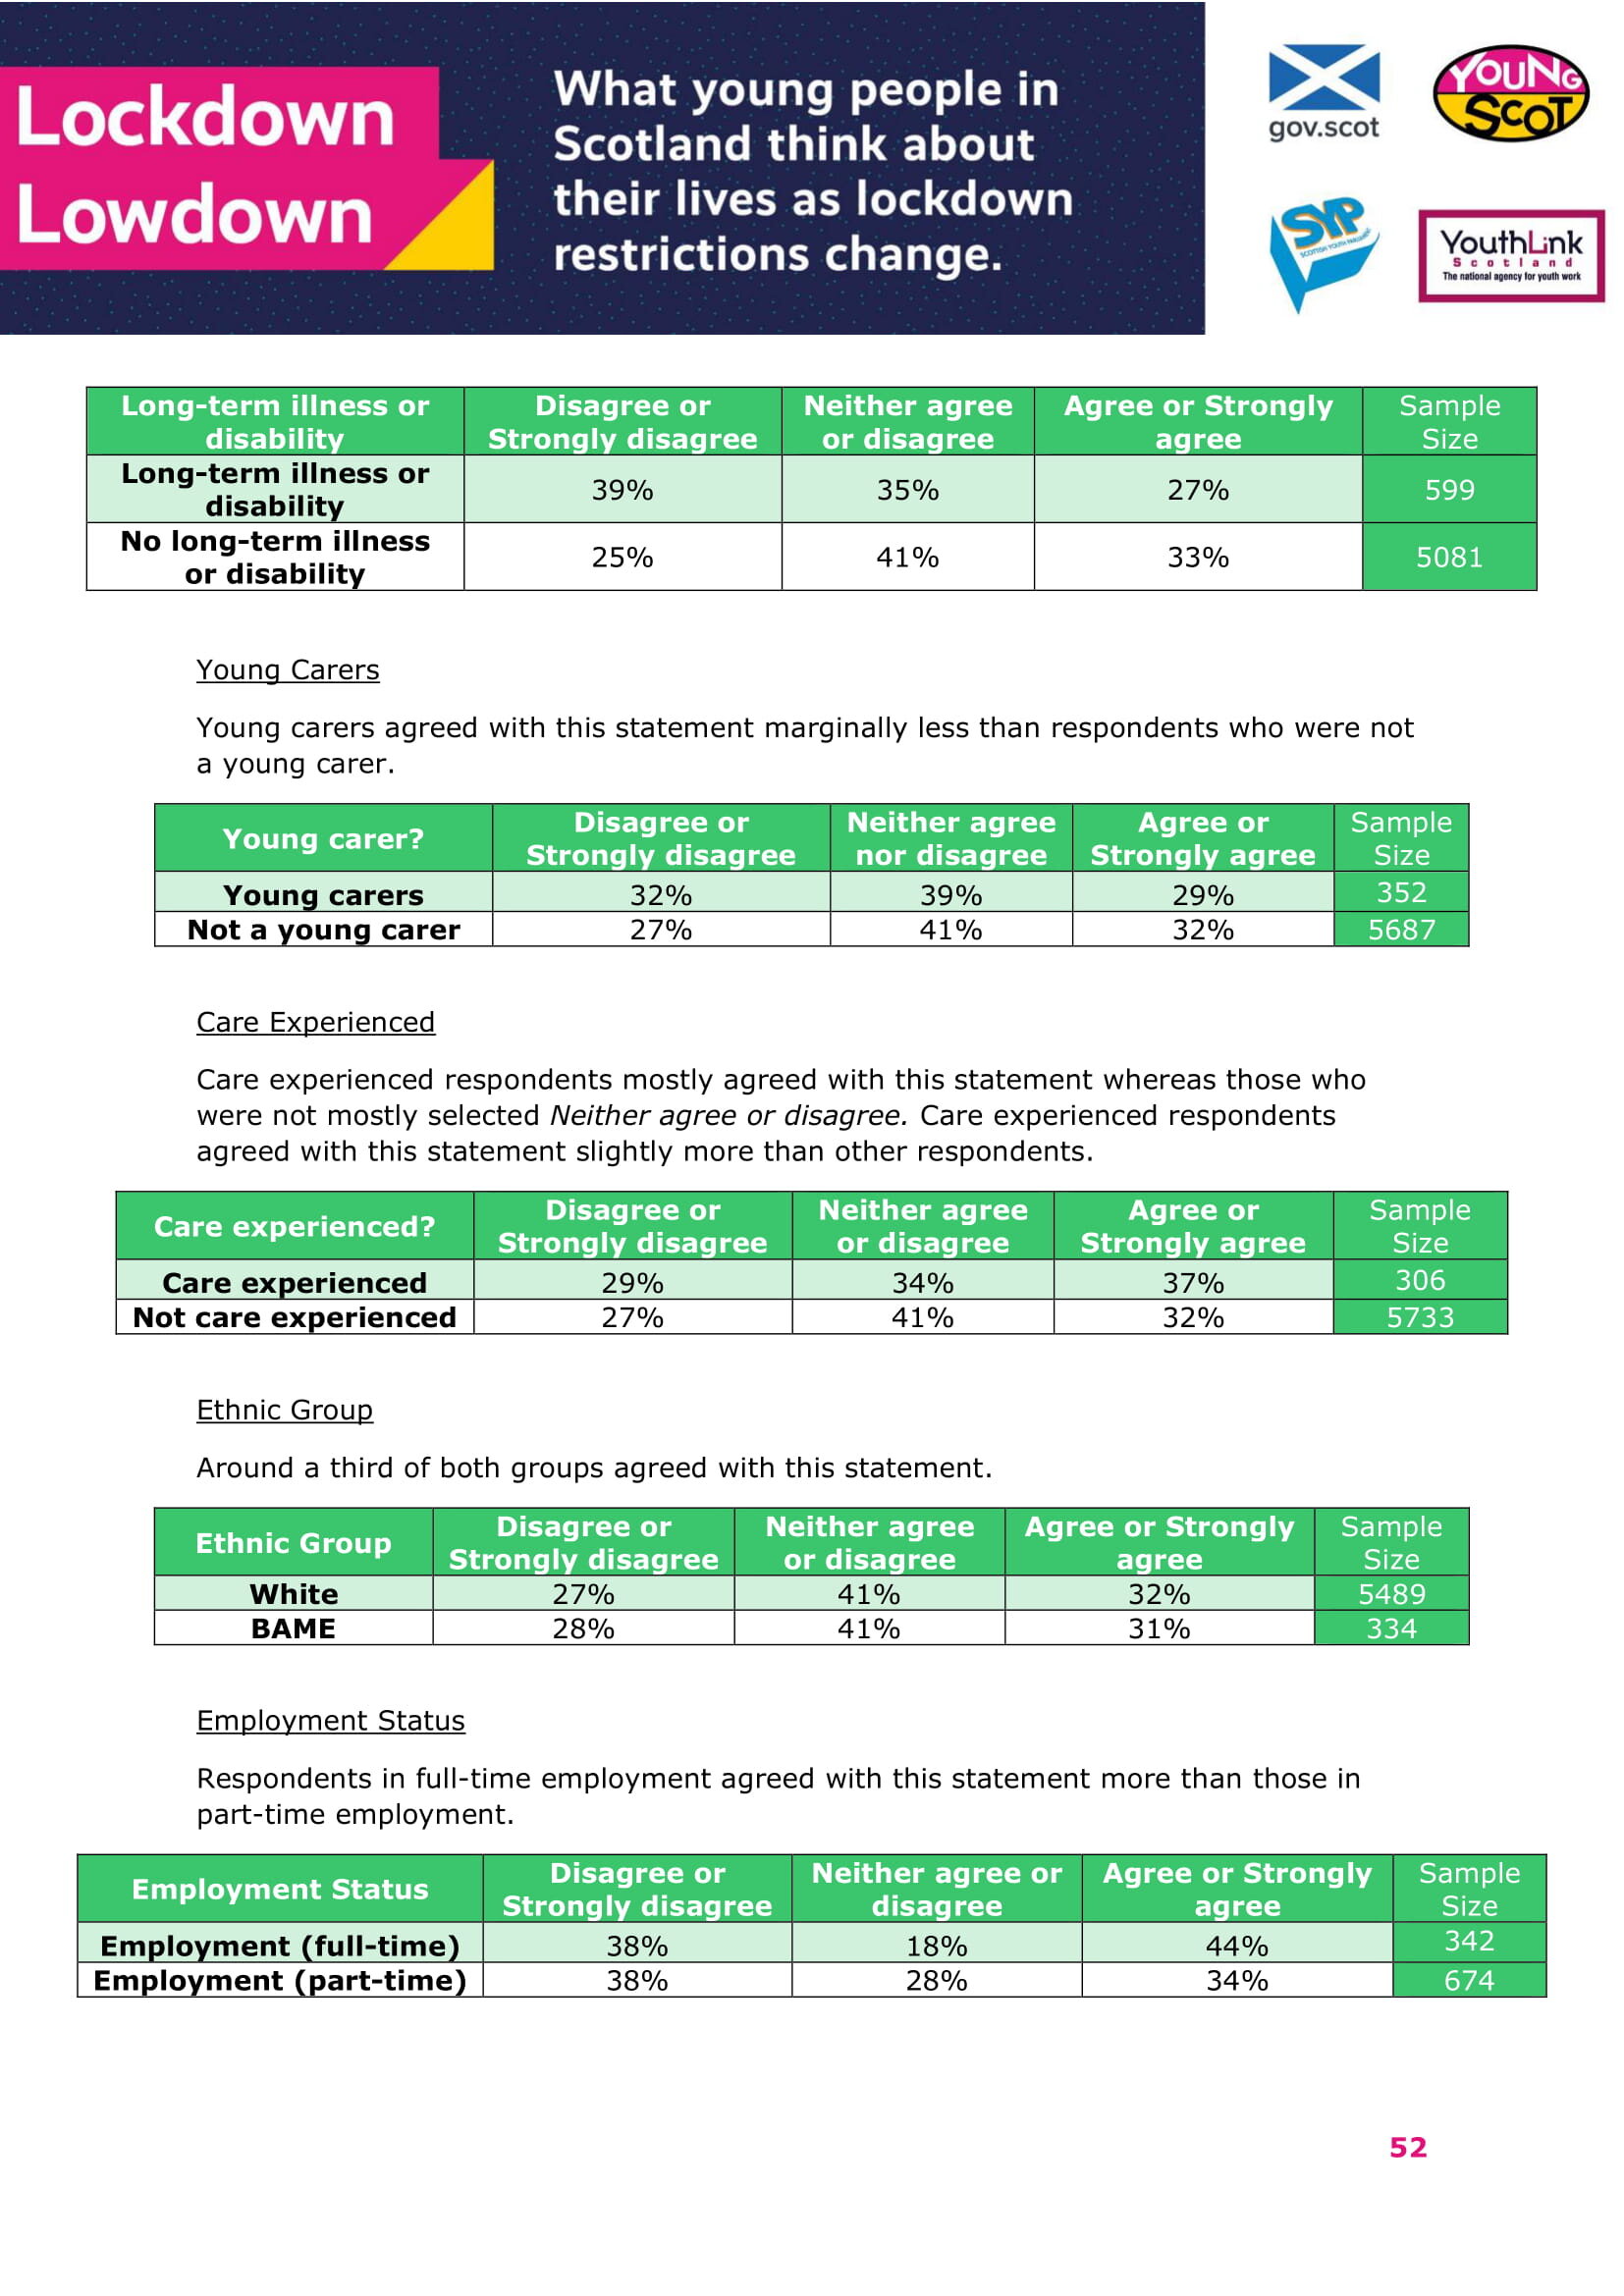
• Respondents who had a long-term illness or disability were less likely to agree that they felt good about their future employment prospects than those who did not (27% of respondents who had a long-term illness or disability compared with 33% of those who did not).
• When asked for any further thoughts on employment, respondents who had a long-term illness or disability expressed concern about job security in their industry and the inability/difficulty to find a job slightly more than the other group. This was a qualitative question with fewer responses compared to others.
Impact of coronavirus generally (including mental and physical health)
• Respondents who had a long-term illness or disability were much less likely to say that they felt good about their physical health and wellbeing than the other group (38% of respondents who had a long-term illness or disability compared with 63% of those who did not).
• Respondents who had a long-term illness or Respondents who had a long-term illness or disability were less likely to say that they felt good about their mental health and wellbeing much less than the other group (26% of respondents who had a long-term illness or disability compared with 44% of those who did not).
• In terms of feeling able to access their rights as a young person, respondents who had a long-term illness or disability were less likely to agree with this statement than those who did not (50% of respondents who had a long-term illness or disability compared with 67% of those who did not).
• Respondents who had a long-term illness or disability were much more likely to be concerned about catching the virus than those who did not (61% of respondents who had a long-term illness or disability compared with 43% of those who did not).
• Respondents who had a long-term illness or disability were more likely to be concerned about a second wave of coronavirus than those who did not (70% of respondents who had a long-term illness or disability compared with 78% of those who did not).
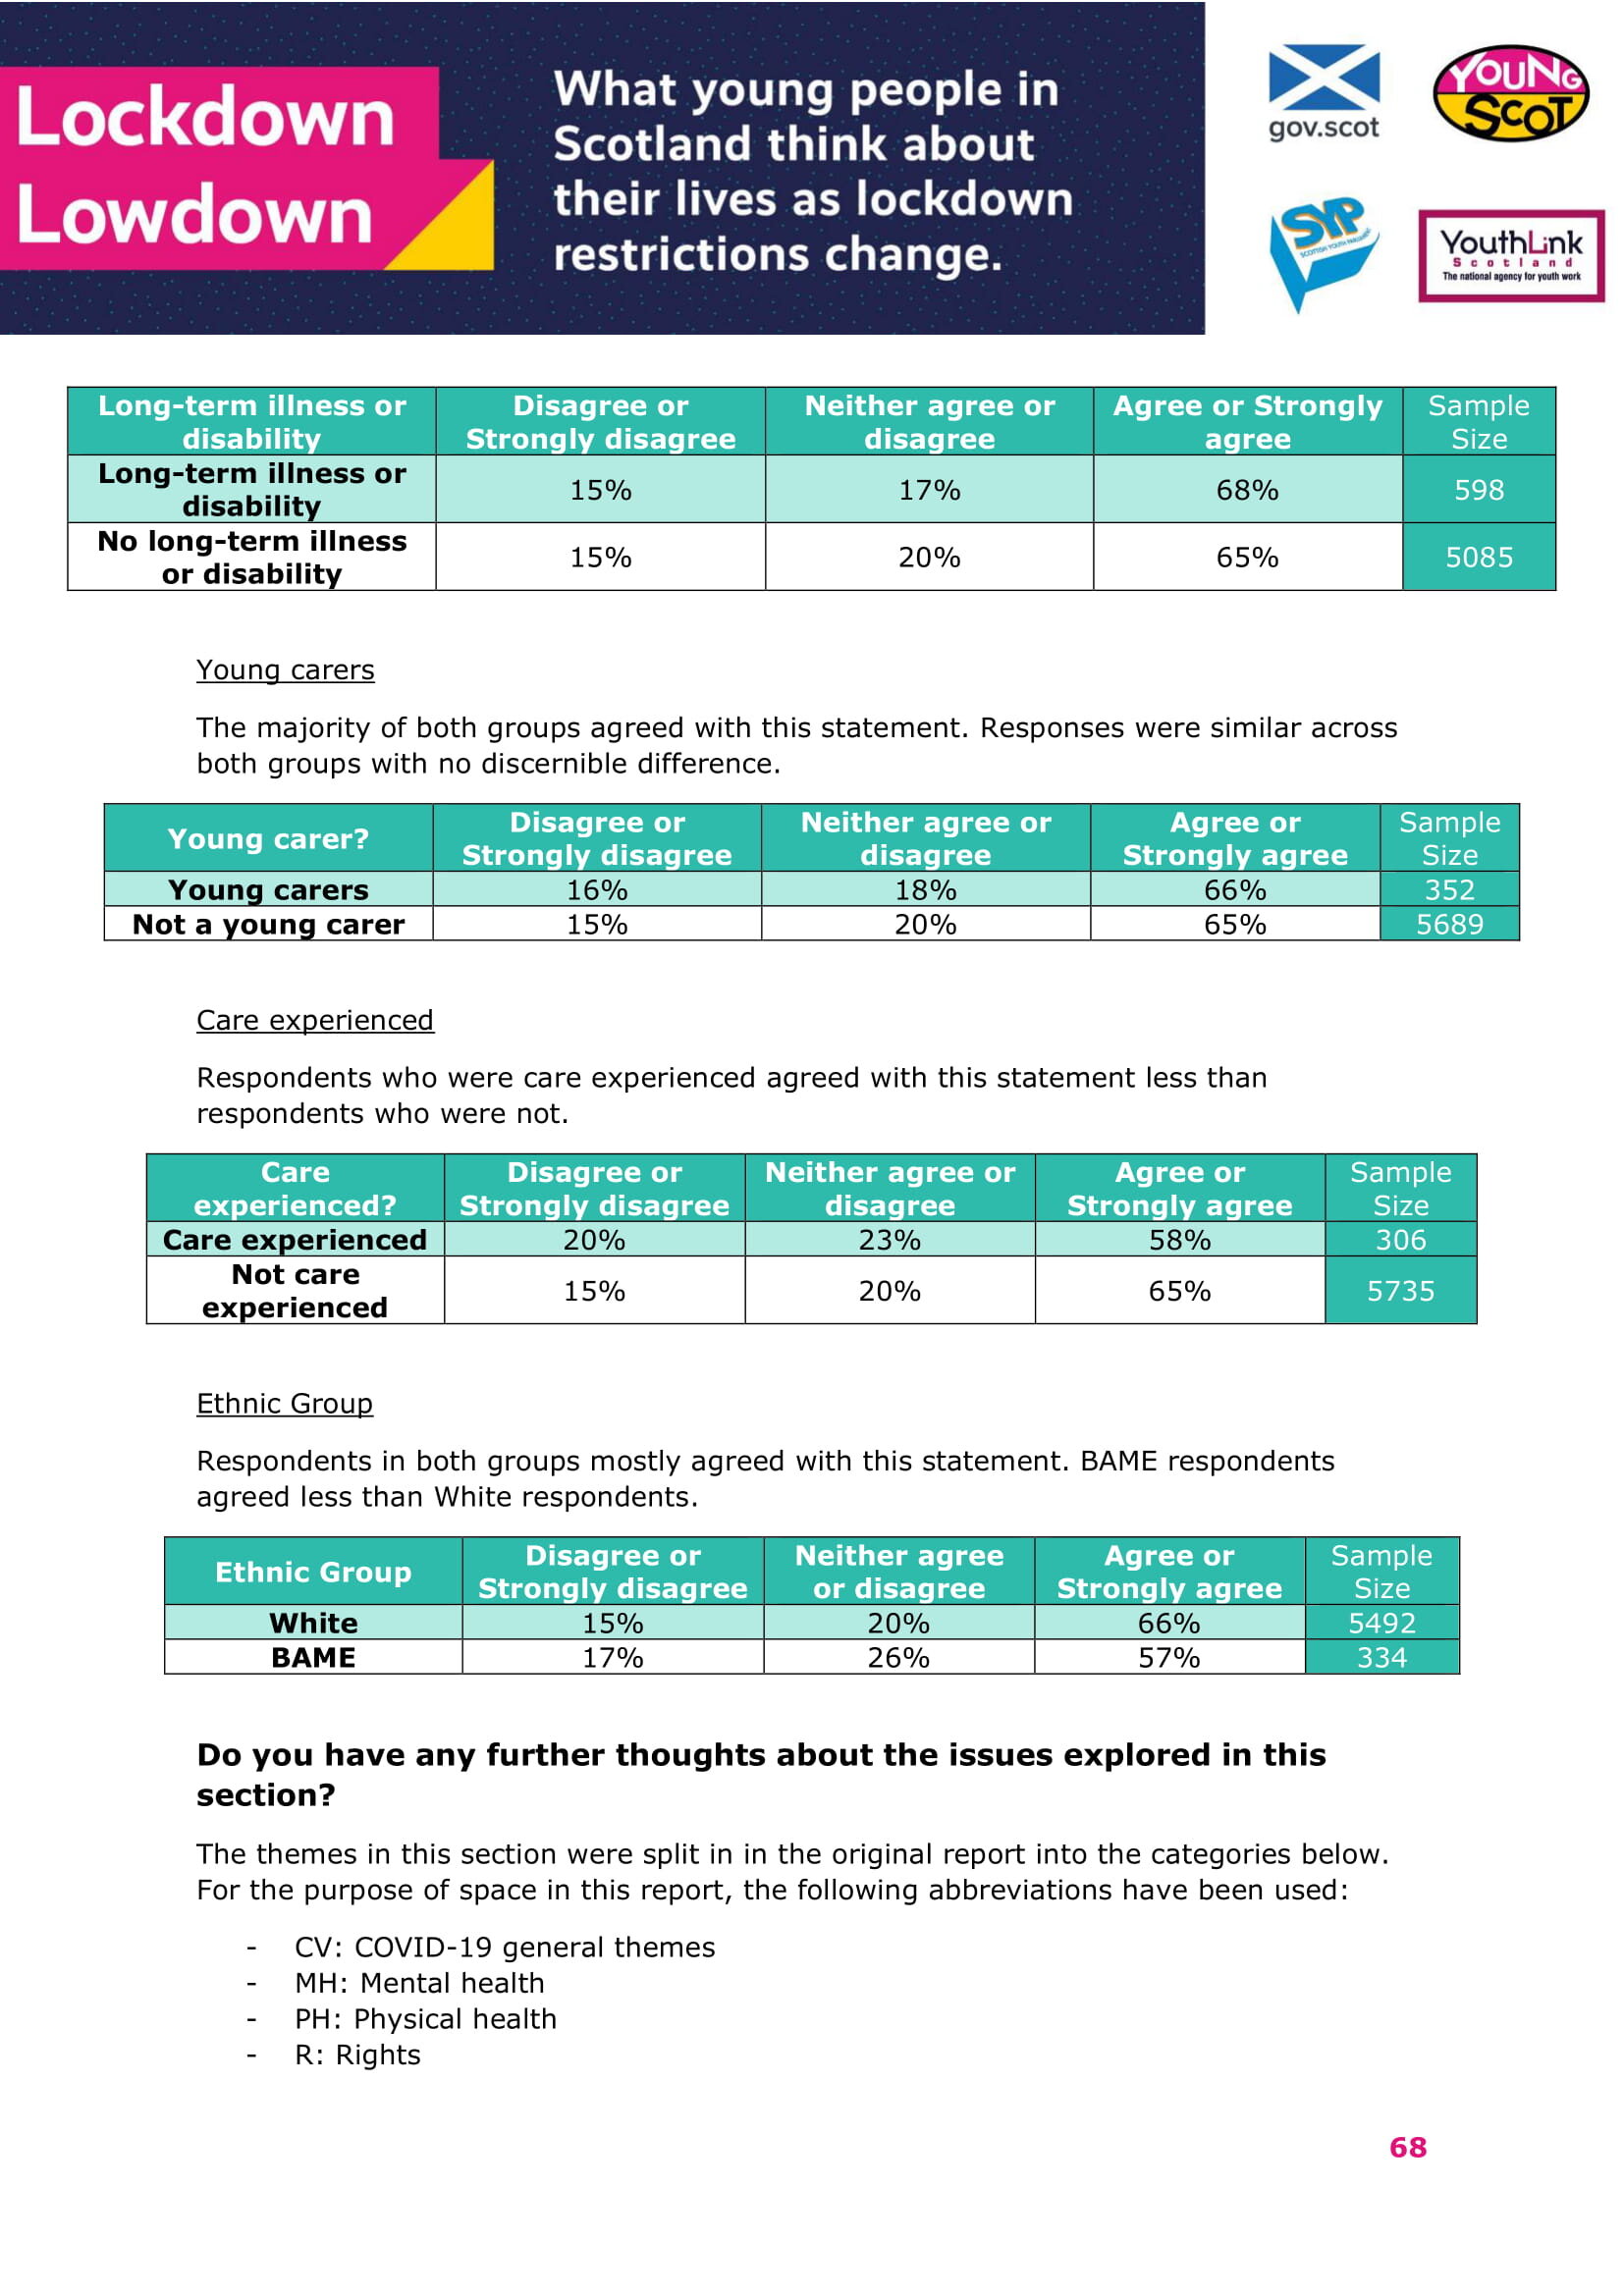
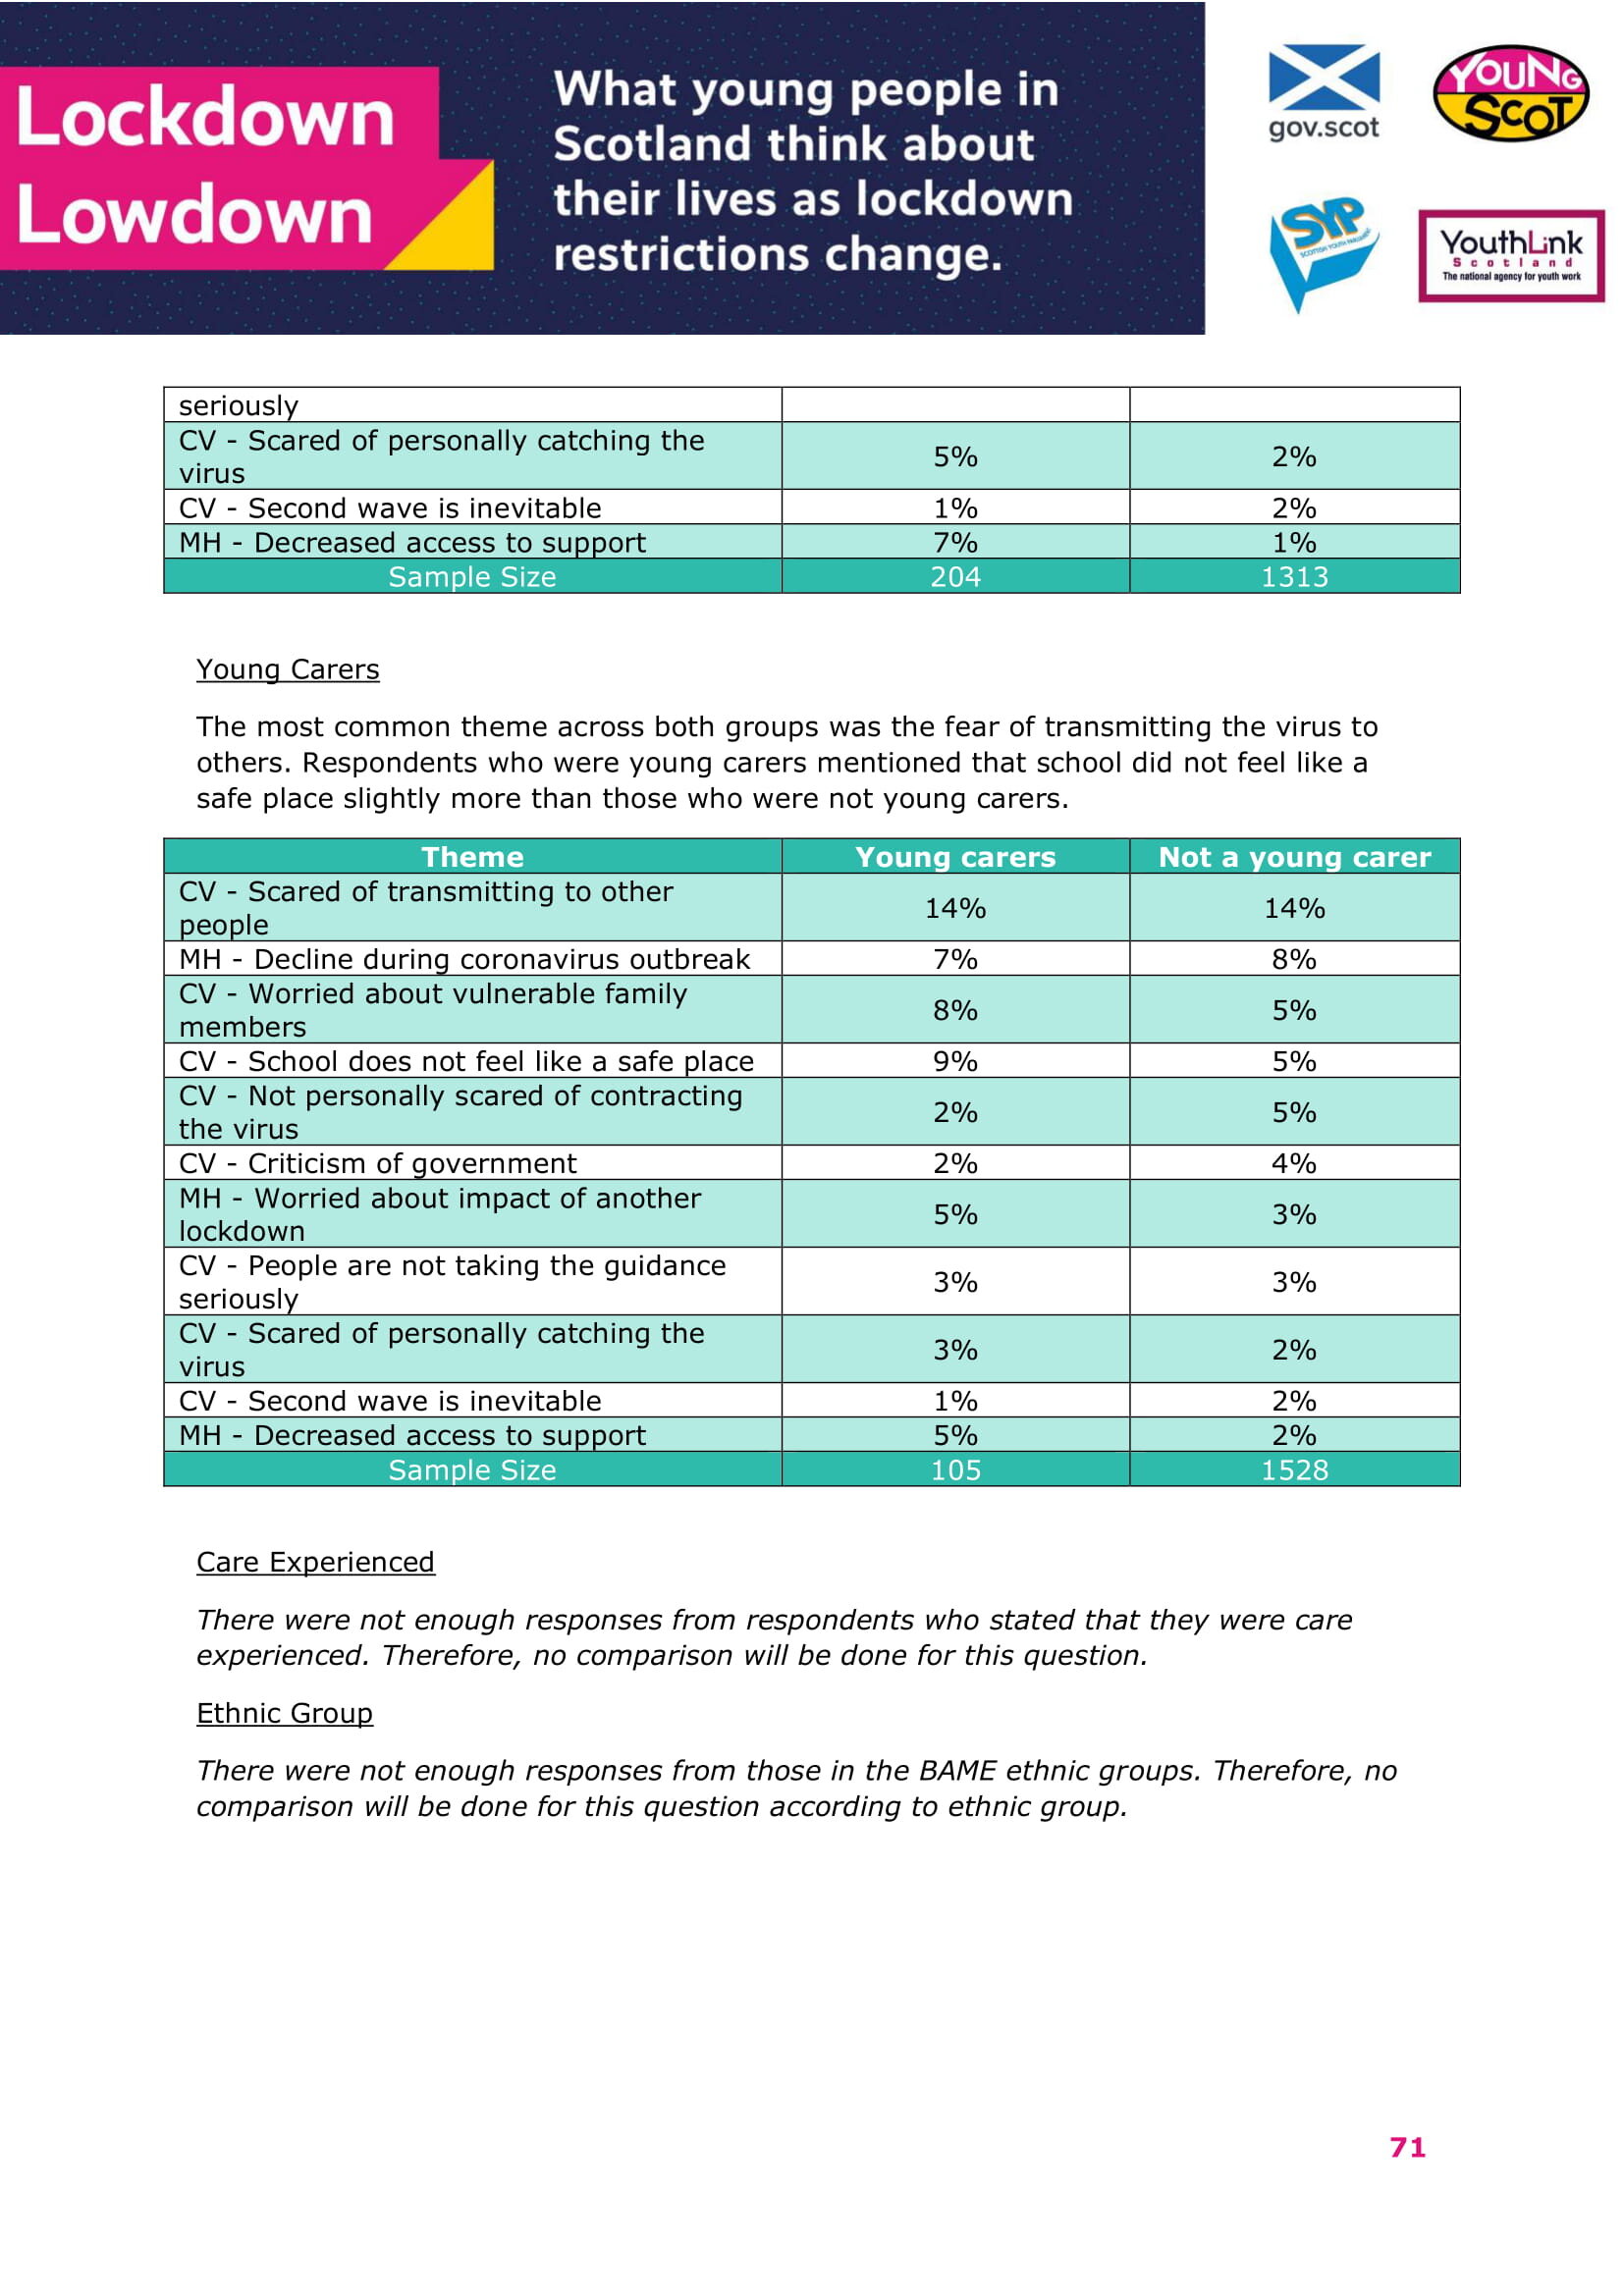
• When asked for further thoughts, the most common theme from respondents who had a long-term illness or disability was a decline in mental health during the pandemic. The most common theme from respondents with no long-term illness or disability was the fear of transmitting the virus to others. This was a qualitative question with fewer responses compared to others.
Access to information
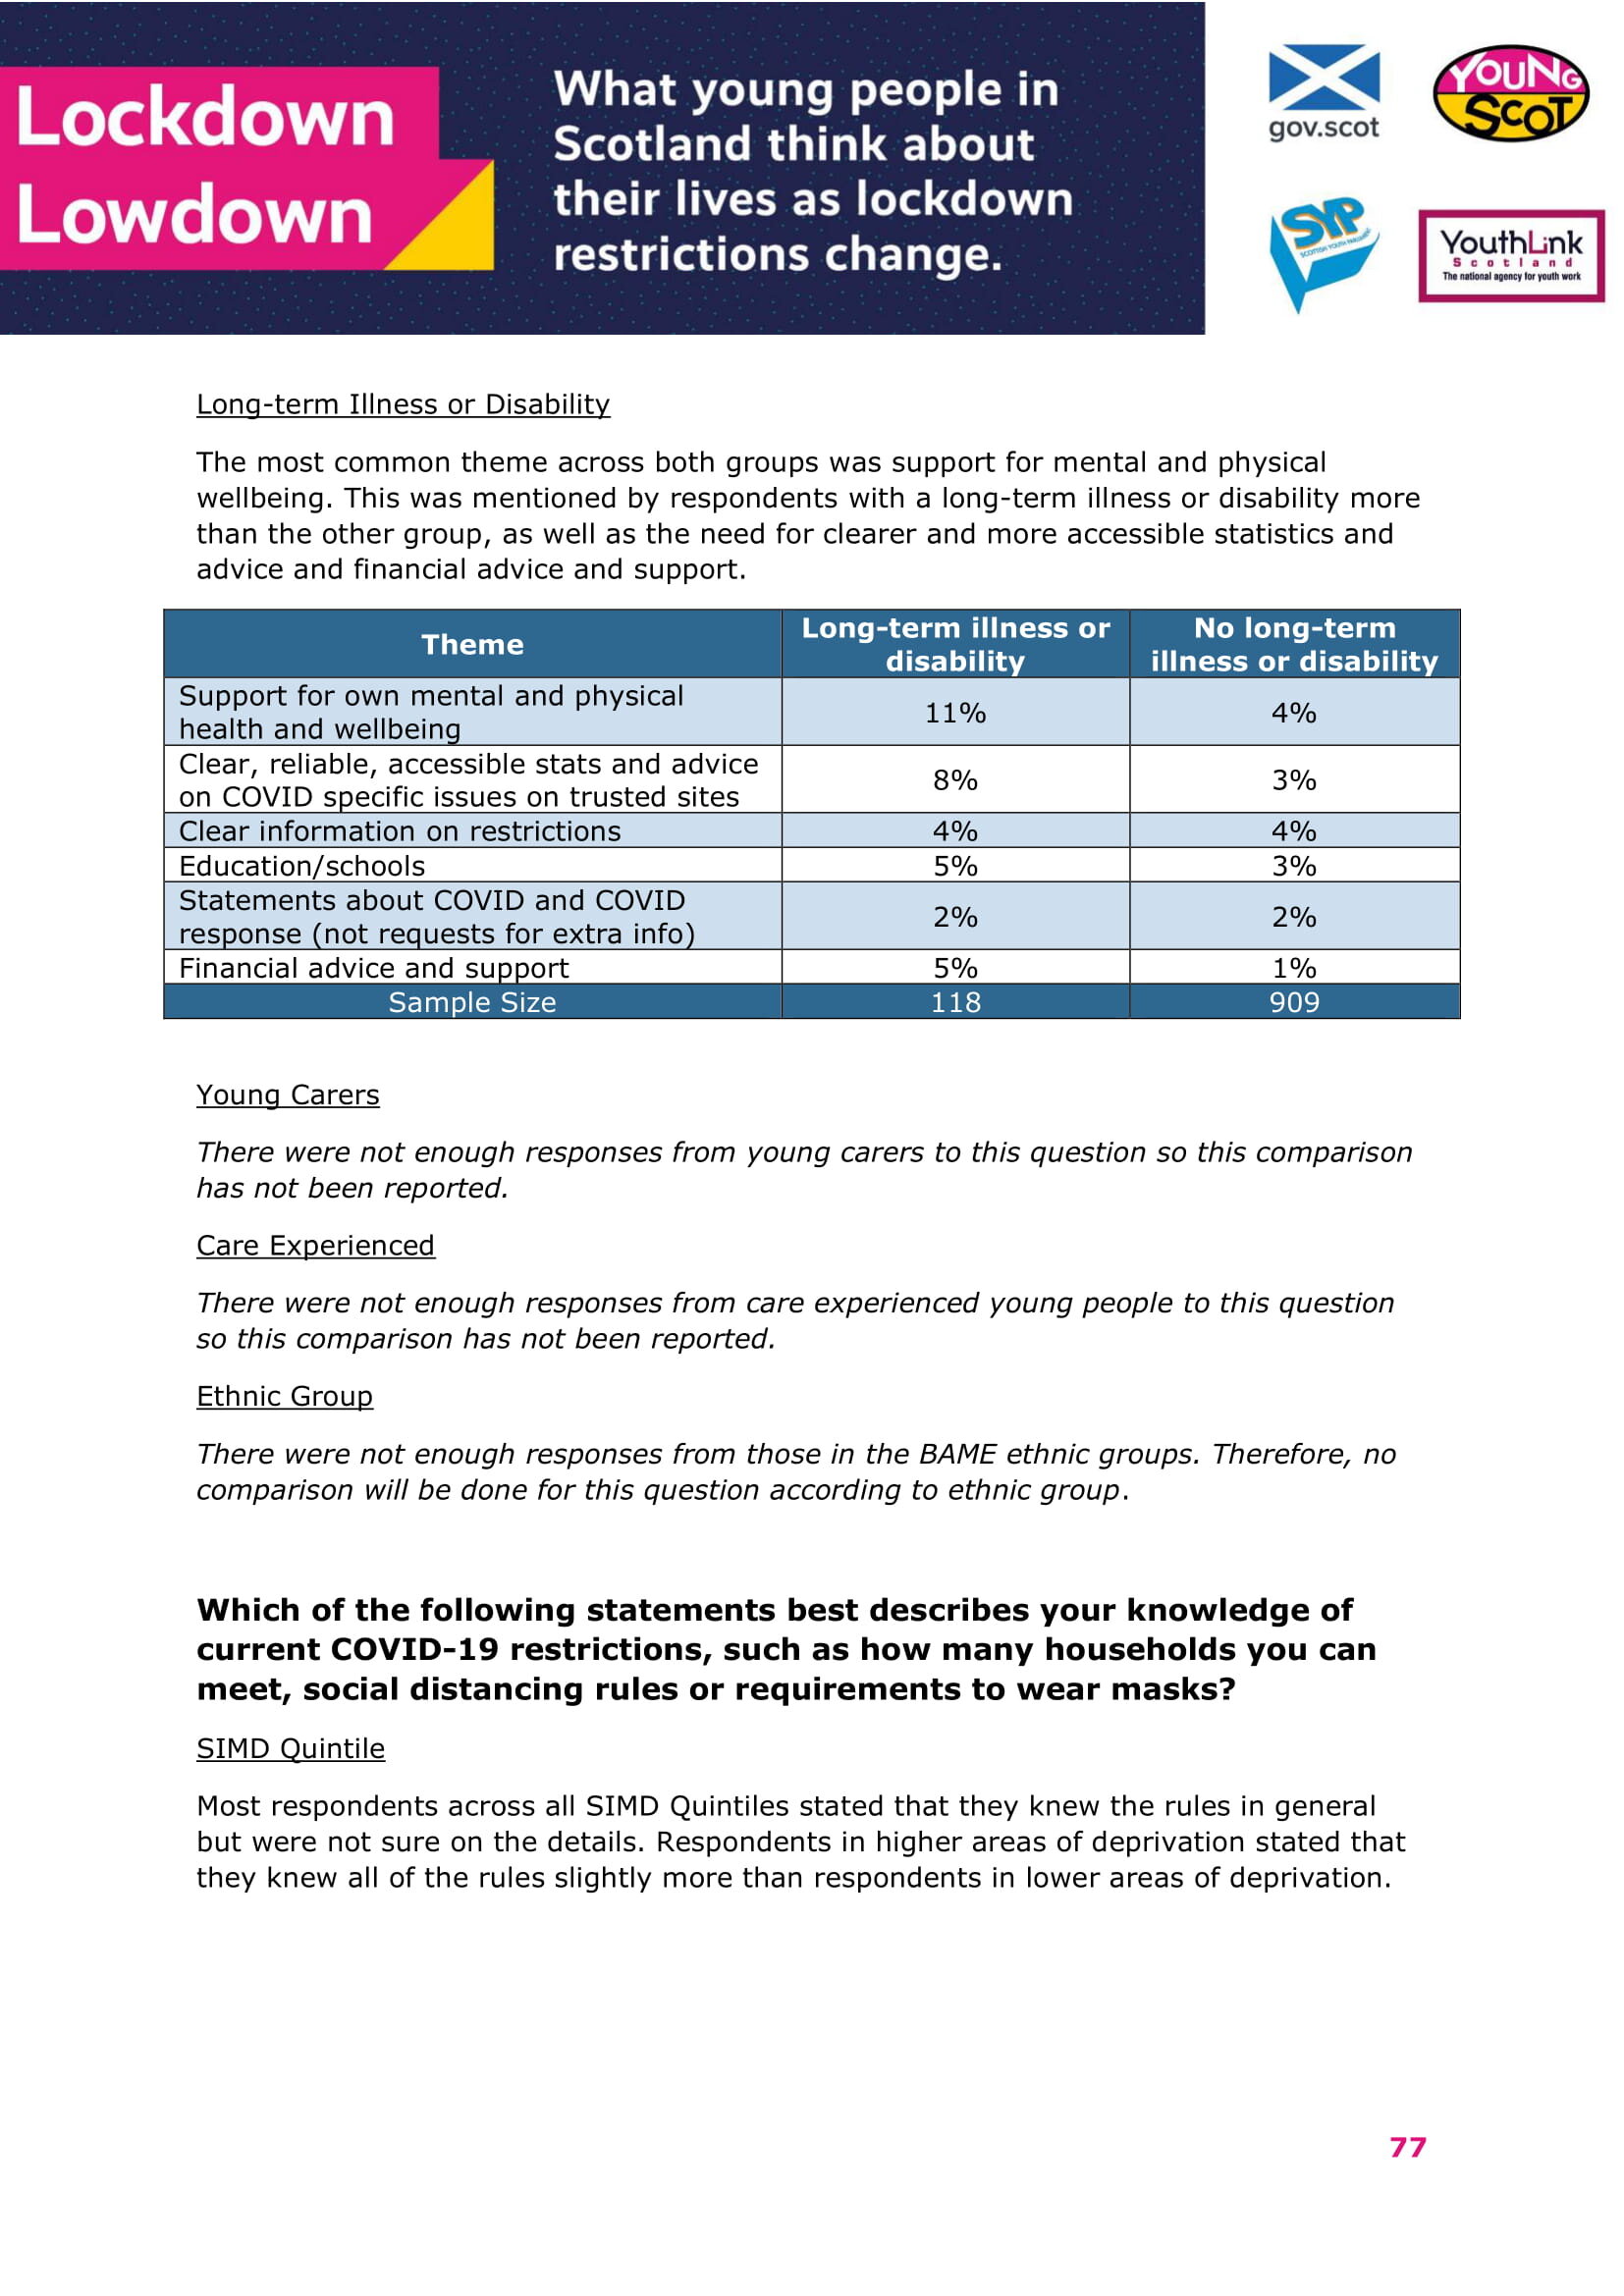
• When asked if there were any topics that respondents wanted more information on, the most common theme across all respondents was support for mental and physical wellbeing. This was more likely to mentioned by respondents who had a long-term illness or disability, as was the need for clearer and more accessible statistics and advice and financial advice and support. This was a qualitative question with fewer responses compared to others.
• Respondents with no long-term illness or disability more likely to say that they knew all of the current rules than those who had a long-term illness or disability (54% of respondents who did not have a long-term illness or disability compared with 41% of those who did).
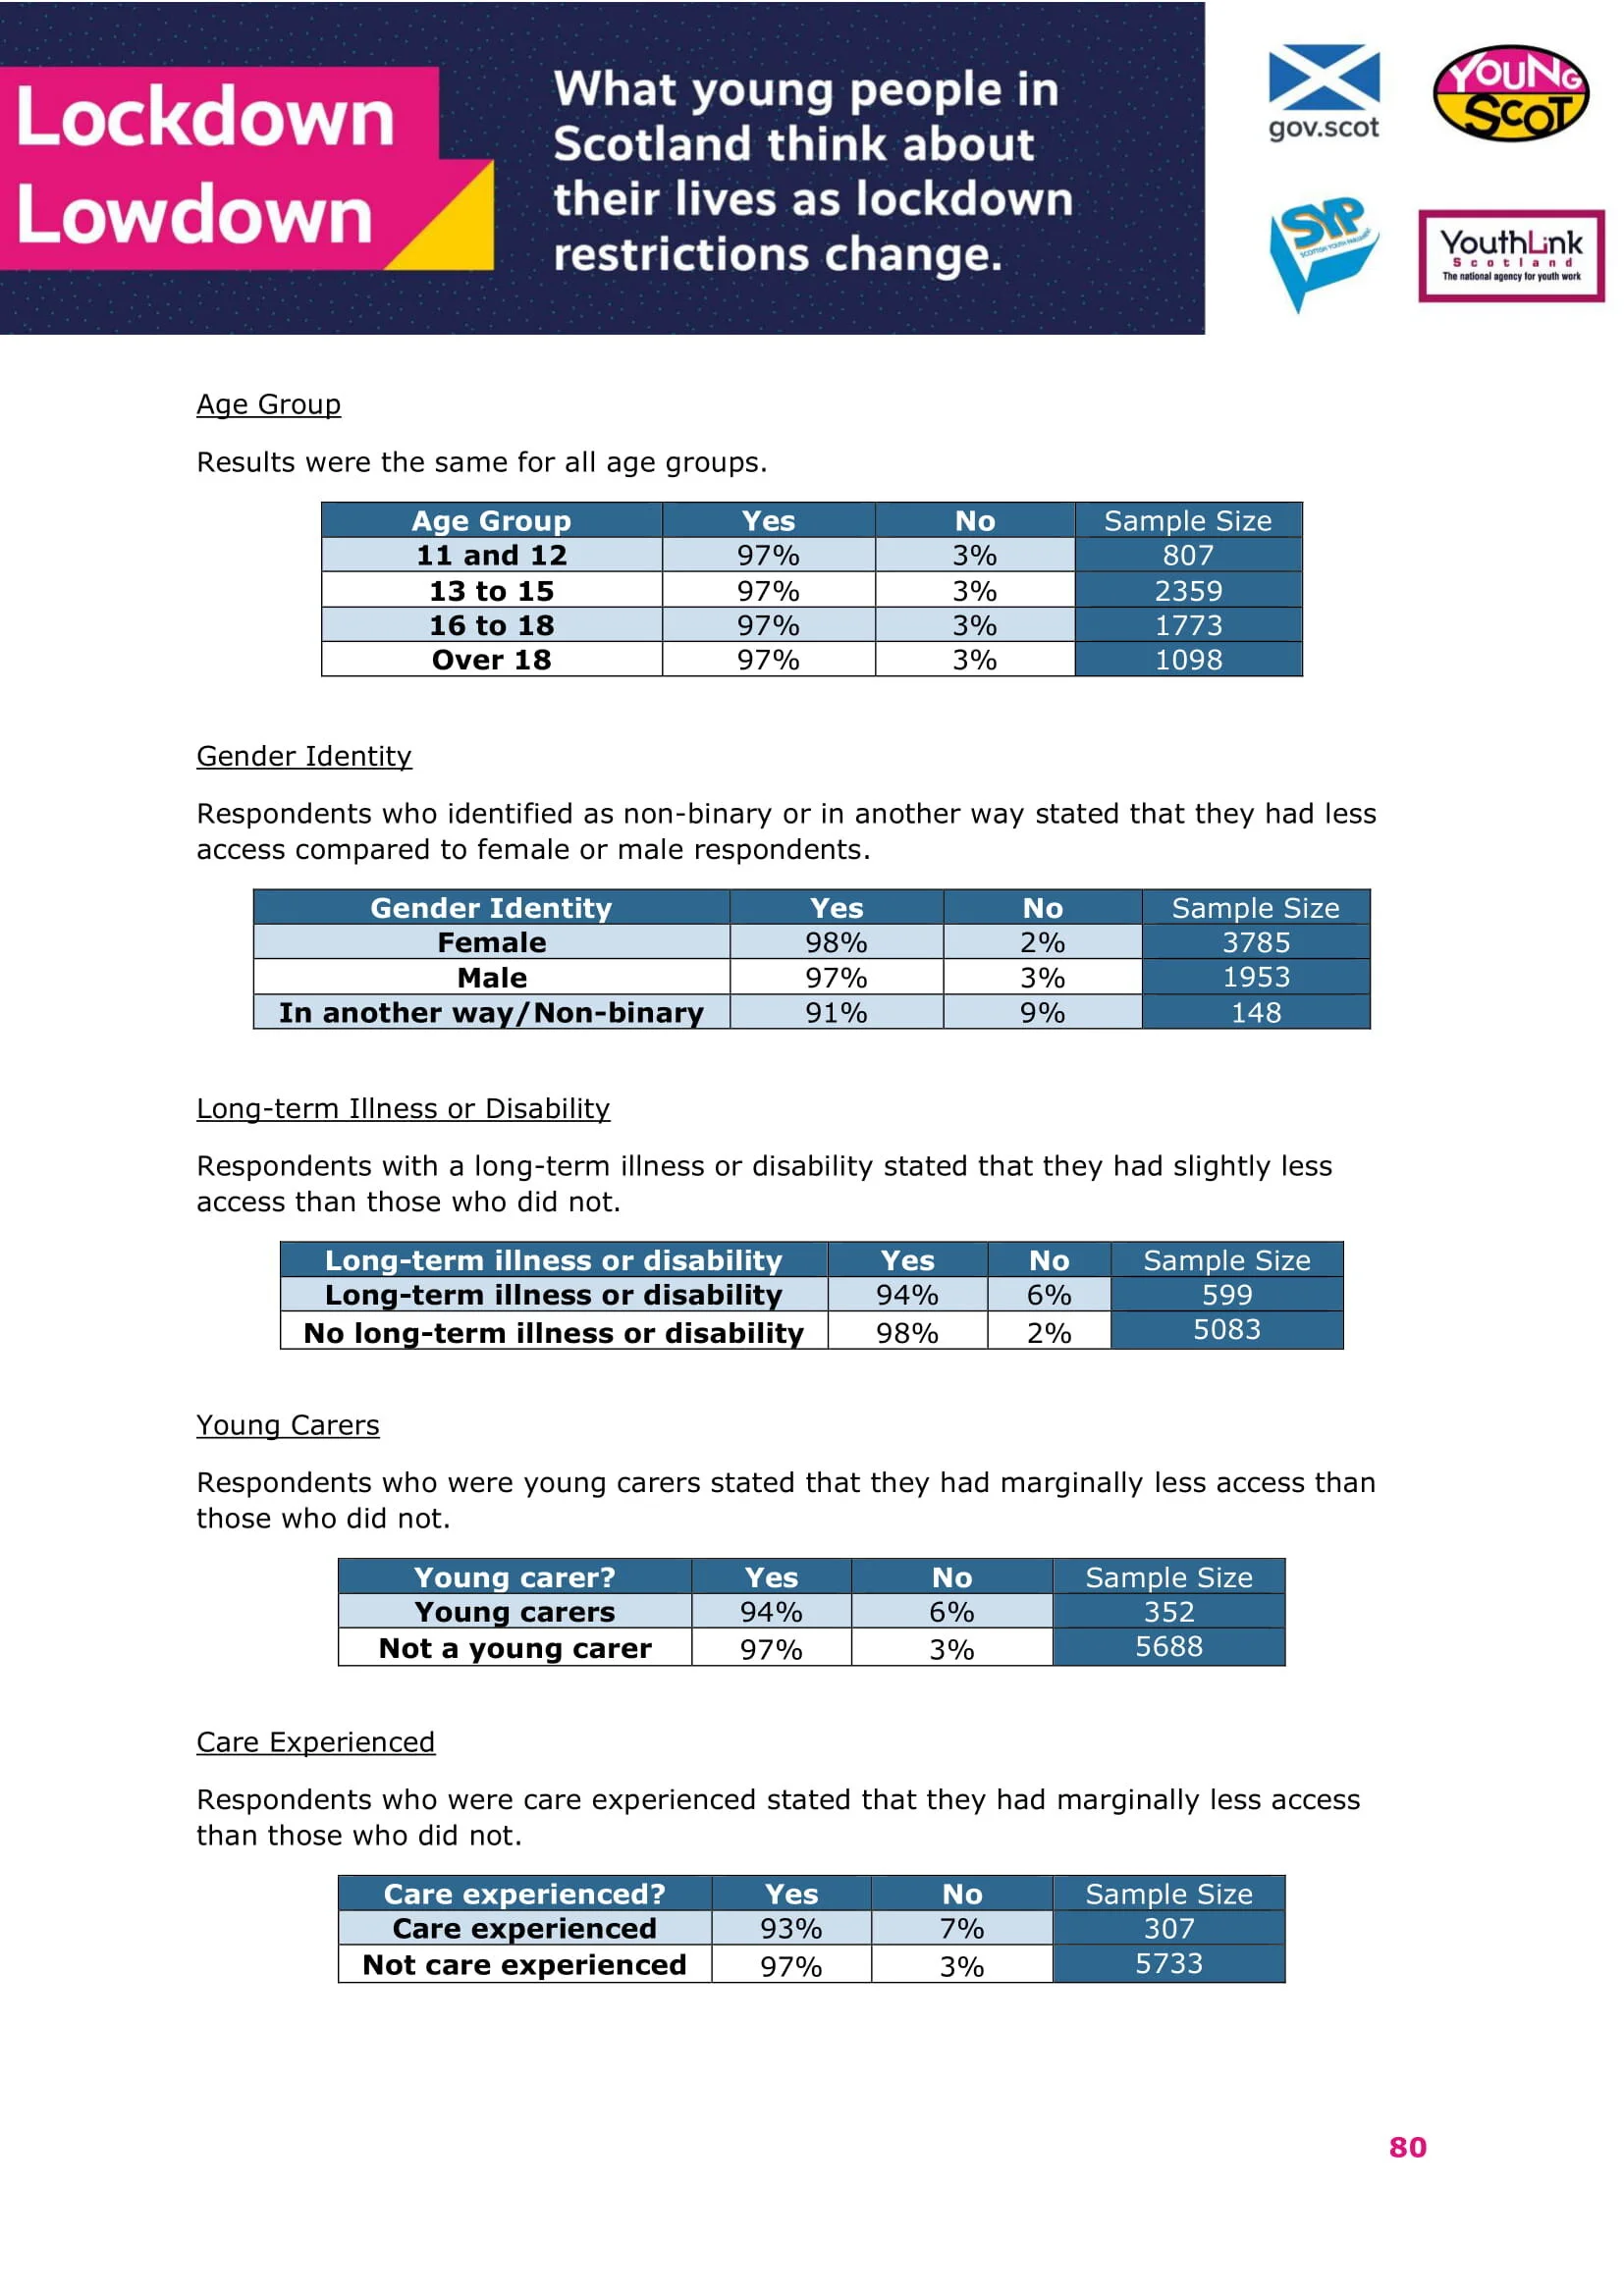
• The majority of both groups stated that they had access to a personal device that could connect online. Respondents who had a long-term illness or disability were slightly less likely to have access than those who did not (94% of respondents who had a long-term illness or disability compared with 98% of those who did).
• The majority of both groups stated that they had access to a device within their local community that could connect online. Respondents who had a long-term illness or disability were slightly less likely to have access than those who did not (78% of respondents who had not have a long-term illness or disability compared with 87% of those who did not).
Key Findings: Young Carers
There were 352 respondents stated that they were a young carer. 5,690 respondents selected No and one respondent left the box blank.
Impact of coronavirus on education
• When respondents were asked if they were happy about the current arrangements for their educational course, young carers were less likely to agree with this statement others (68% of respondents who were young carers compared with 76% who were not).
• For those who had returned to in-person learning, young carers were less likely to agree that they were happy to be back than others (57% of respondents who were young carers compared with 67% who were not).
• When asked if their educational establishment had re-opened in a safe way, young carers were less likely to agree with this statement than others (53% of respondents who were young carers compared with 64% who were not).
Impact of coronavirus on relationships
• Young carers were less likely to agree that they had a good relationship with their family than others (74% of respondents who were young carers compared with 84% who were not).
• Young carers were less likely to agree that they had a good relationship with their friends than others (77% of respondents who were young carers compared with 84% who were not).
Impact of coronavirus on employment
• In terms of employment, the questions provided no major differences in responses between groups or the sample sizes were not large enough for comparison.
Impact of coronavirus generally (including mental and physical health)
• Young carers were less likely to say that they felt good about their physical health and wellbeing than others (51% of respondents who were young carers compared with 60% who were not).
• Young carers were less likely to say that they felt good about their mental health and wellbeing than others (36% of respondents who were young carers compared with 42% who were not).
• In terms of feeling able to access their rights as a young person, young carers were less likely to agree with this statement than others (56% of respondents who were young carers compared with 64% who were not).
• Young carers were more likely to be concerned about catching the virus than others (56% of respondents who were young carers compared with 44% who were not).
• Young carers were more likely to be concerned about a second wave of coronavirus than others (76% of respondents who were young carers compared with 70% who were not).
Access to information
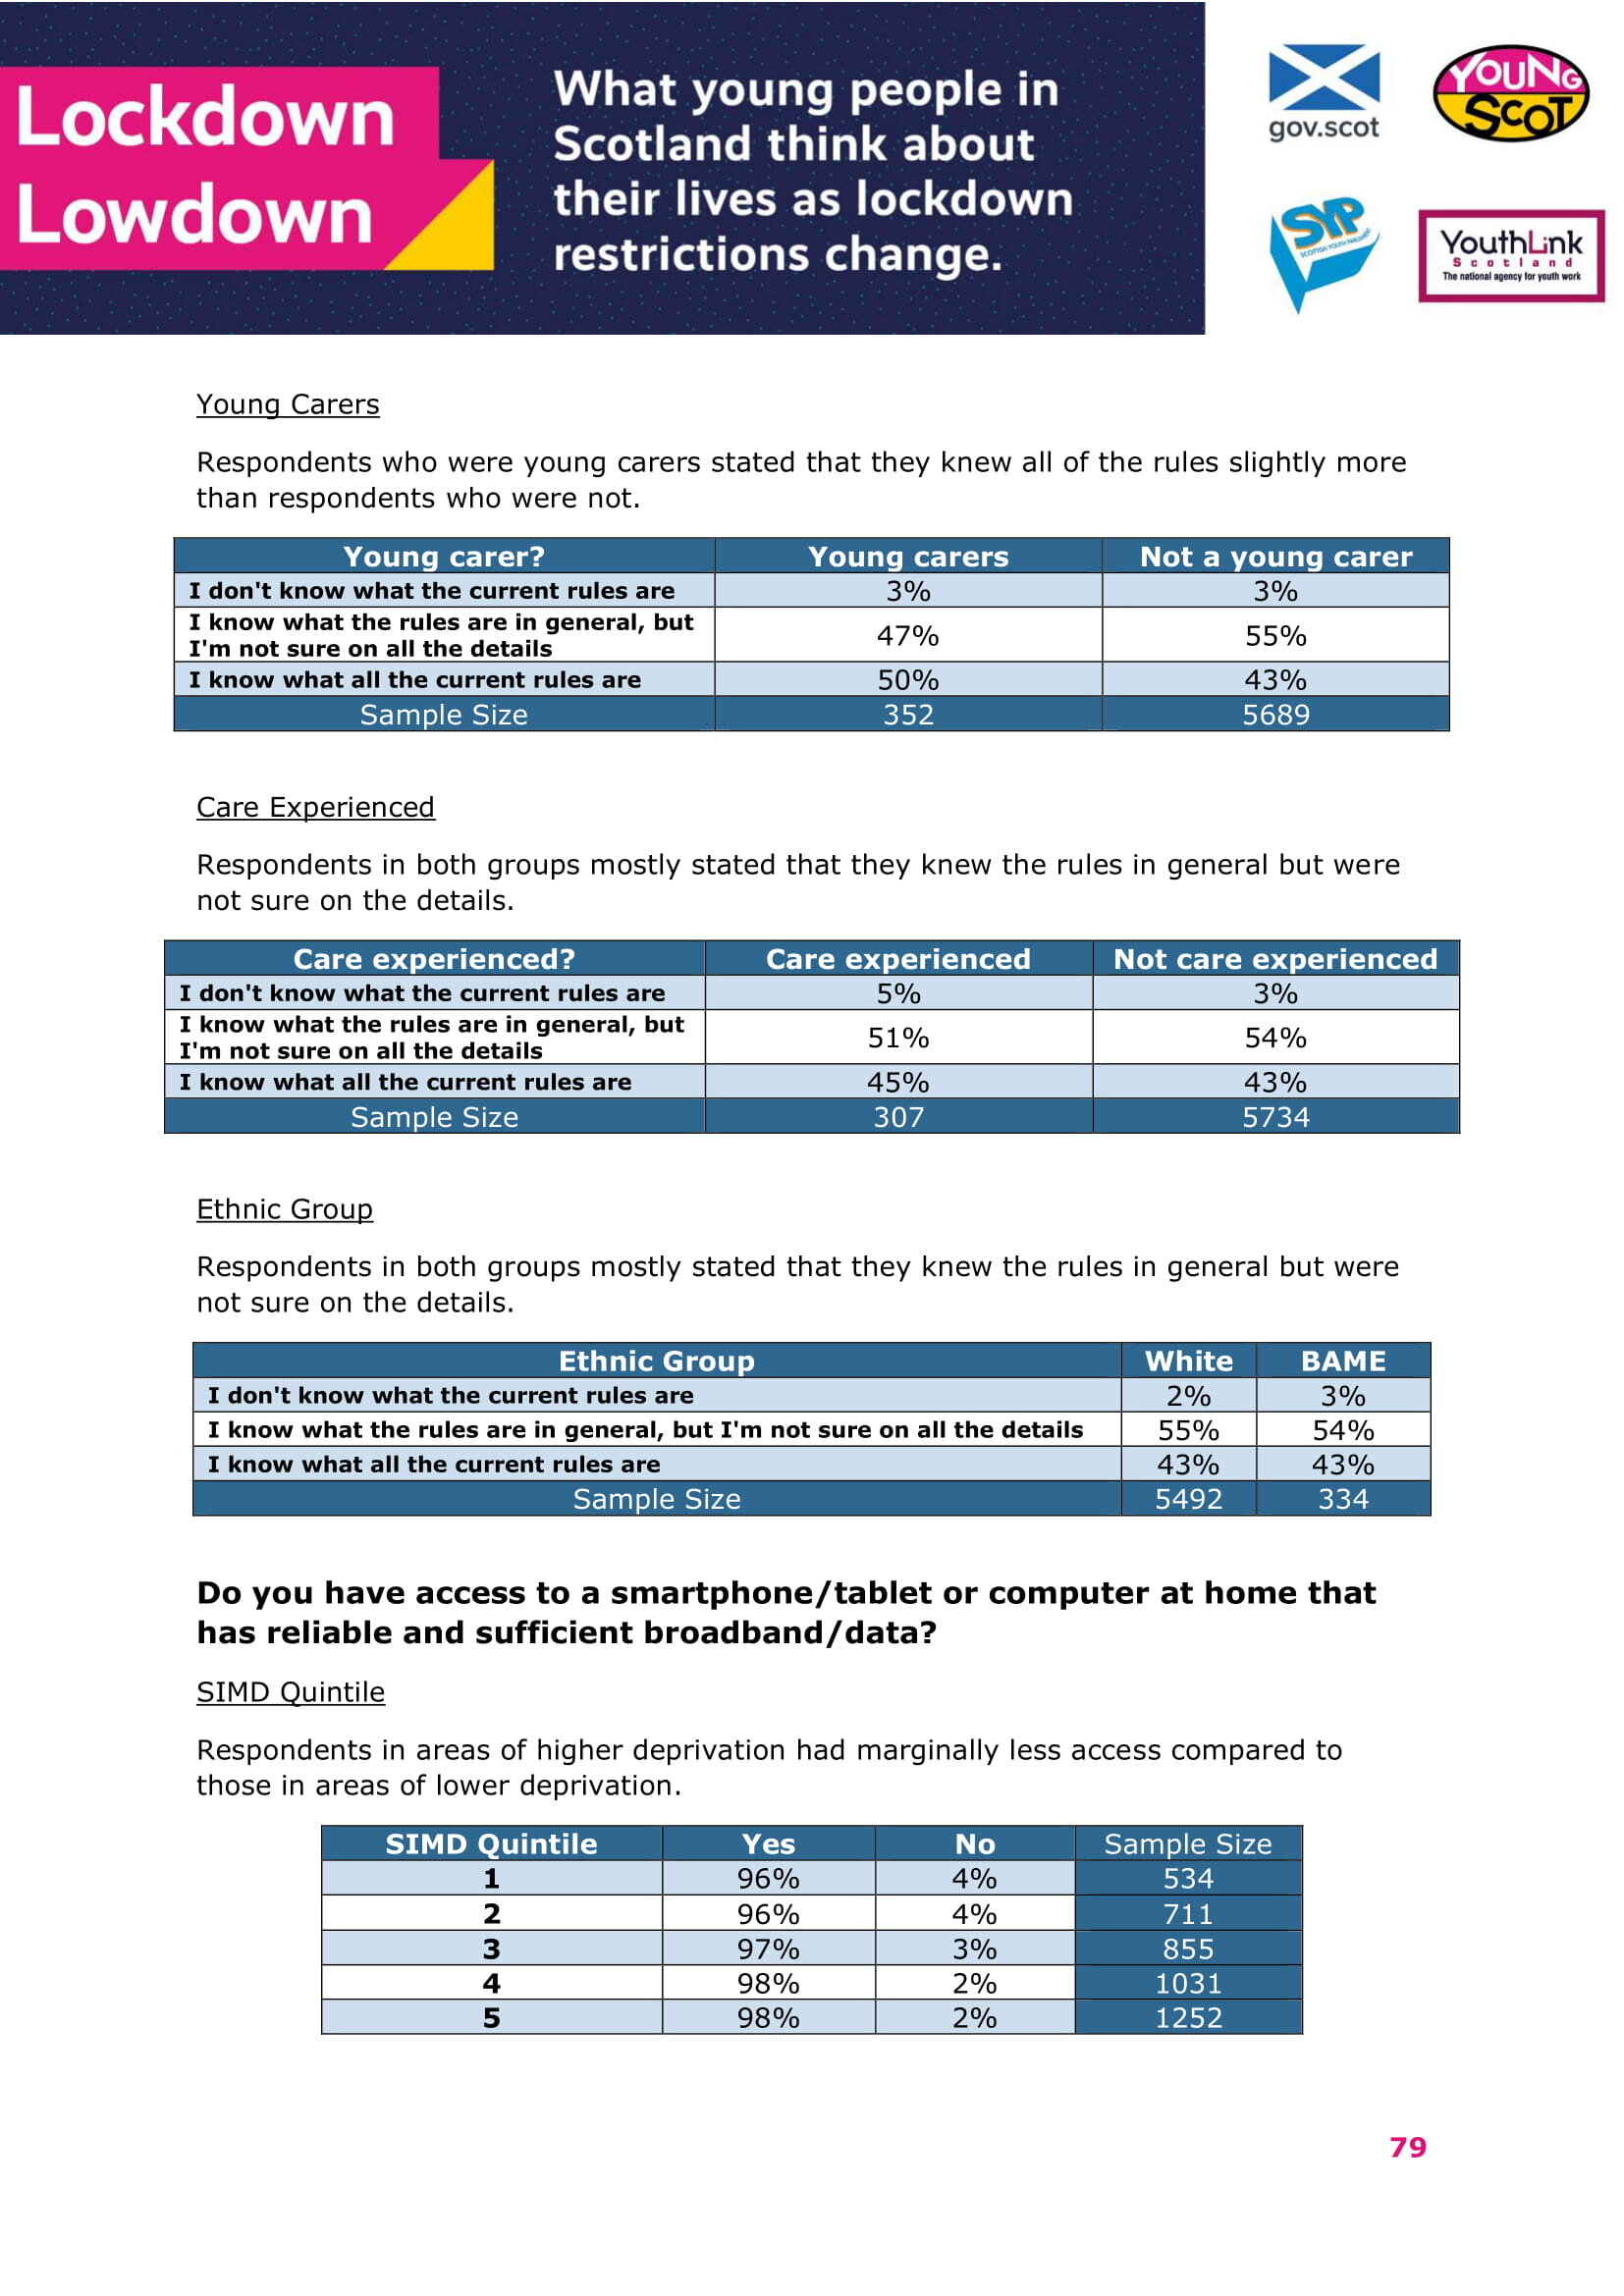
• Young carers were more likely to say that they knew all of the rules than respondents who were not (50% of respondents who were young carers compared with 43% who were not).
• The majority of both groups stated that they had access to a personal device that could connect online. Young carers were slightly less likely to have access compared to those others (94% of respondents who were young carers compared with 97% who were not).
• The majority of both groups stated that they had access to a device within their local community that could connect online. Respondents who were young carers were less likely to have access compared to those who did not (80% of respondents who were young carers compared to 86% who were not).
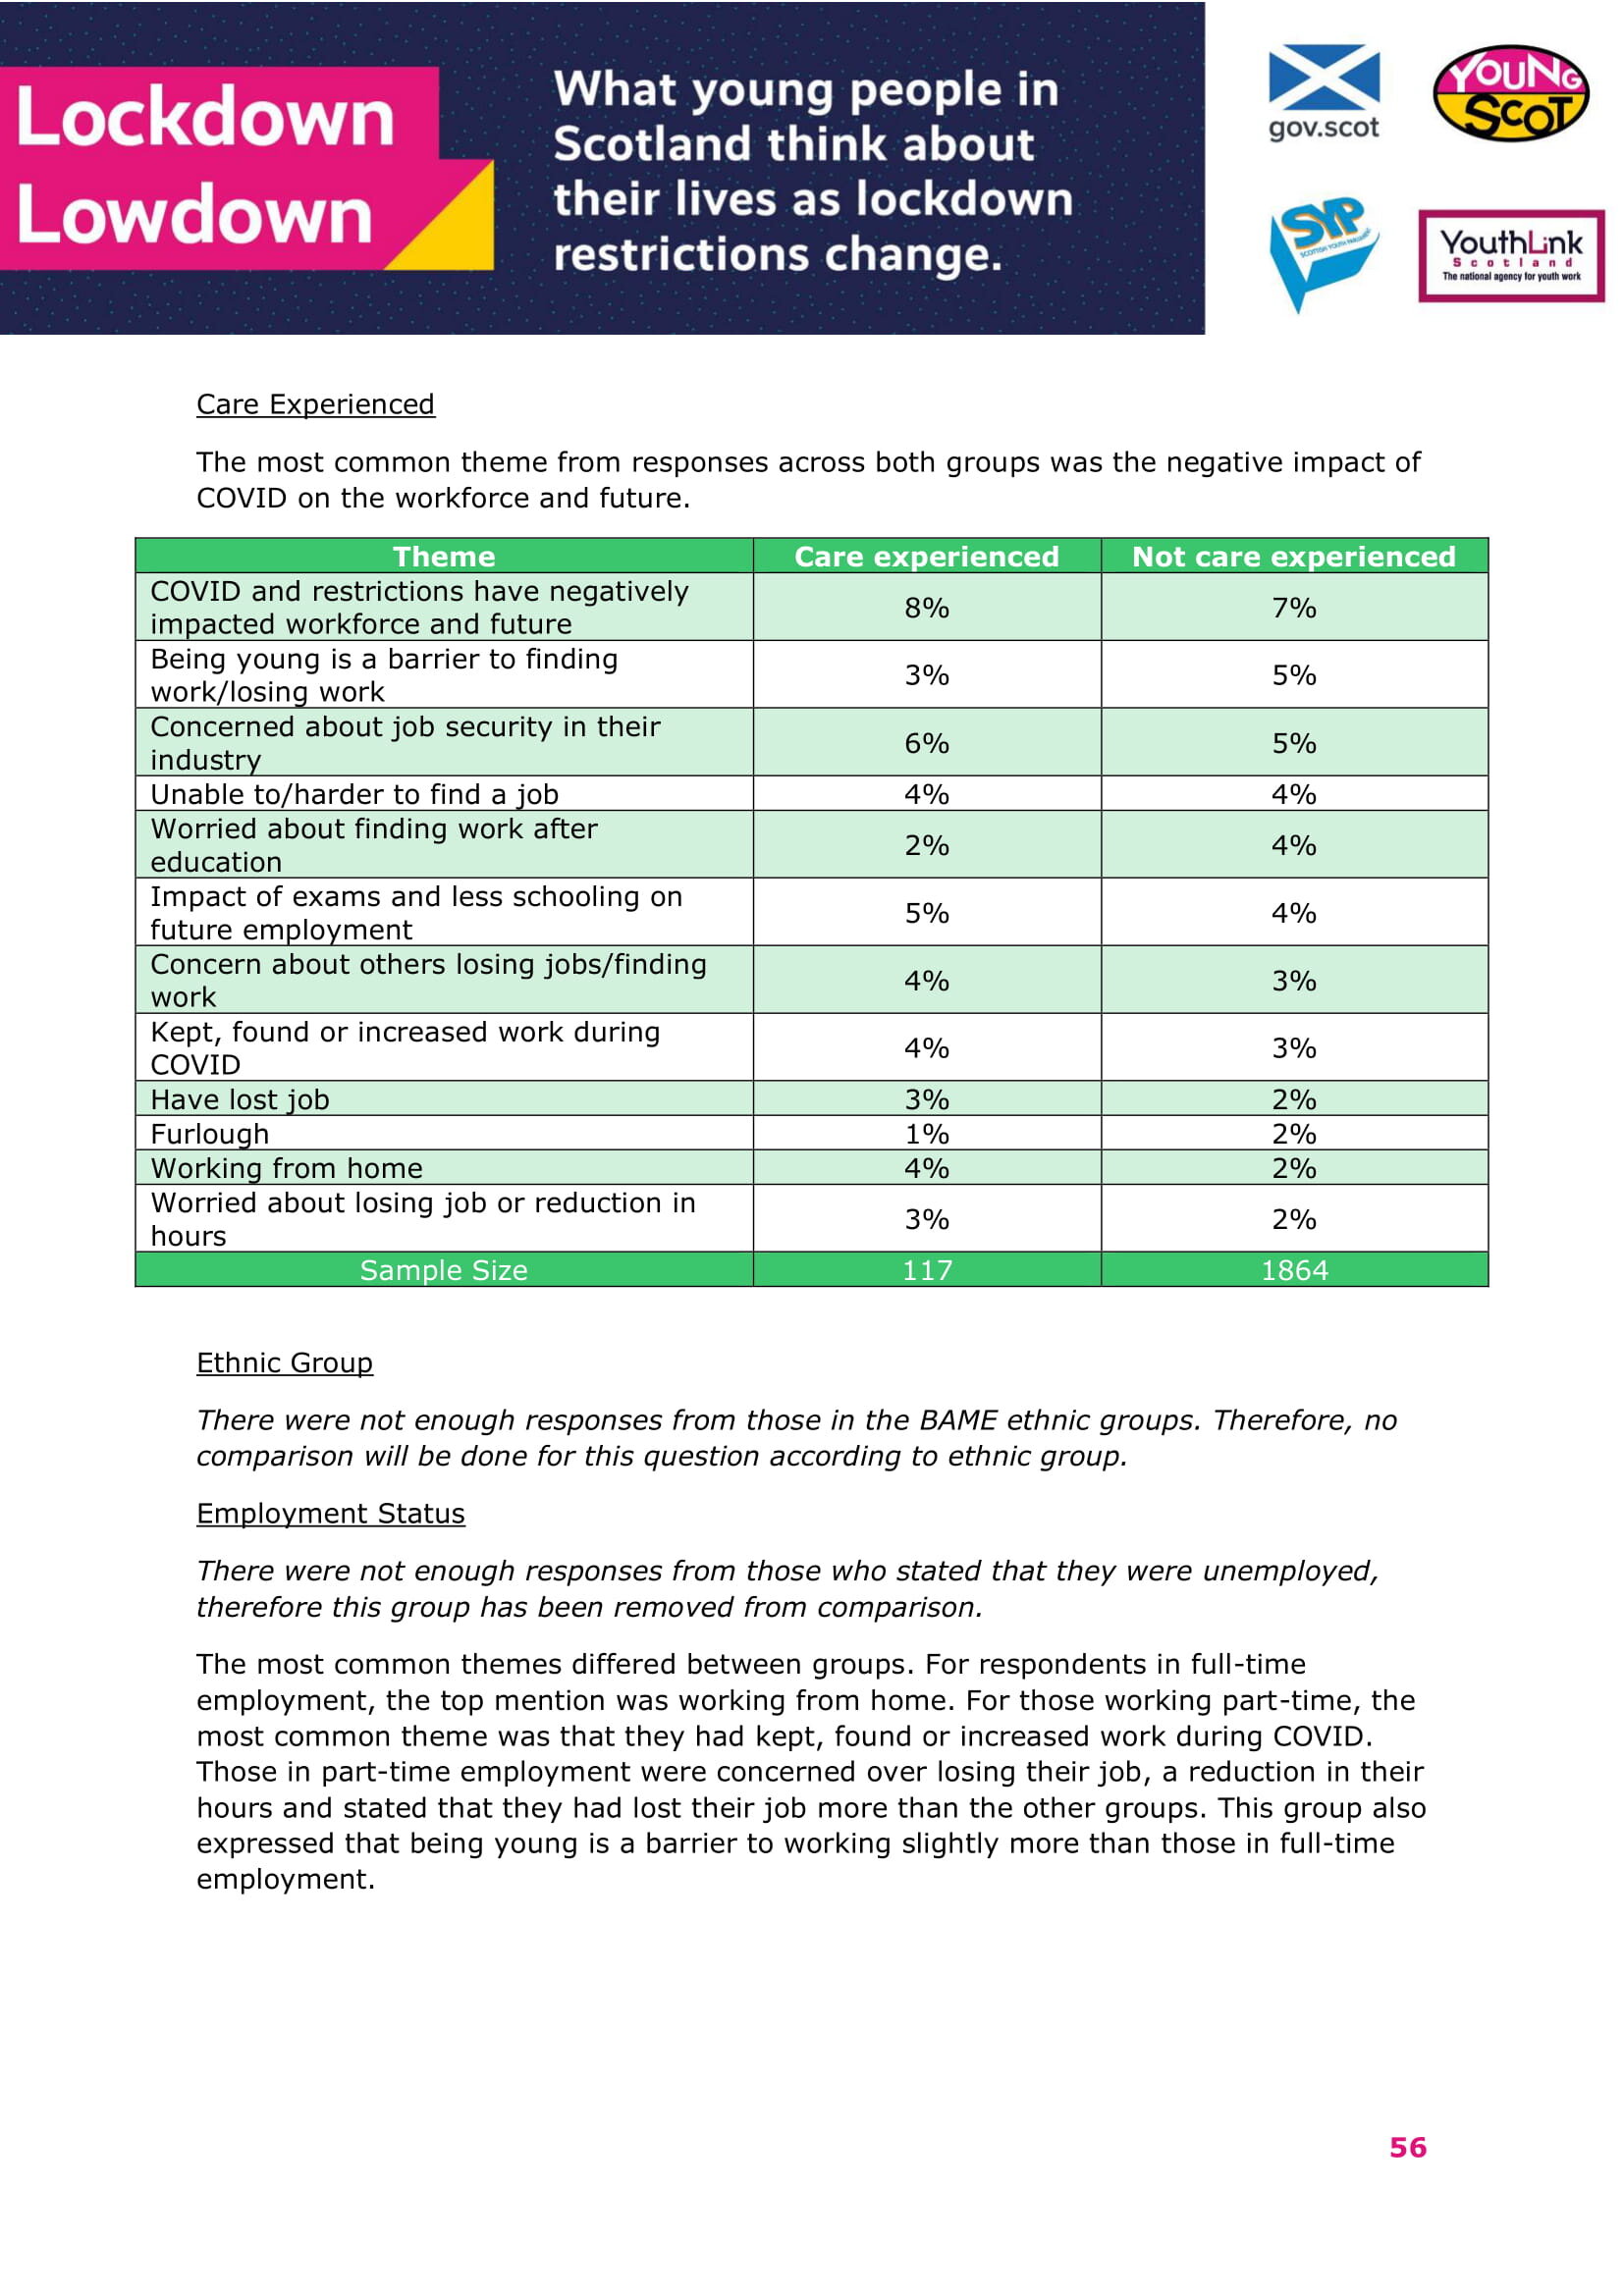
Key Findings: Care Experienced Young People
There were 307 respondents stated that they were a care experienced. 5,735 respondents selected No and one respondent left the box blank.
Impact of coronavirus on education
• In terms of education, the majority of the questions provided no major differences in responses between respondents who were care experienced and those who were not.
• When asked for any further thoughts on education, the most common theme for respondents who were care experienced was expressing difficulties with online learning. For respondents who were not care experienced, the most prominent theme was a concern over exams. This was a qualitative question with fewer responses compared to others.
Impact of coronavirus on relationships
• Respondents who were care experienced were less likely to agree that they had a good relationship with their family than those who were not (71% of respondents who were care experienced compared with 84% who were not).
• Respondents who were care experienced were less likely to agreed that they had a good relationship with their friends than those who were not (78% of respondents who were care experienced compared with 84% who were not).
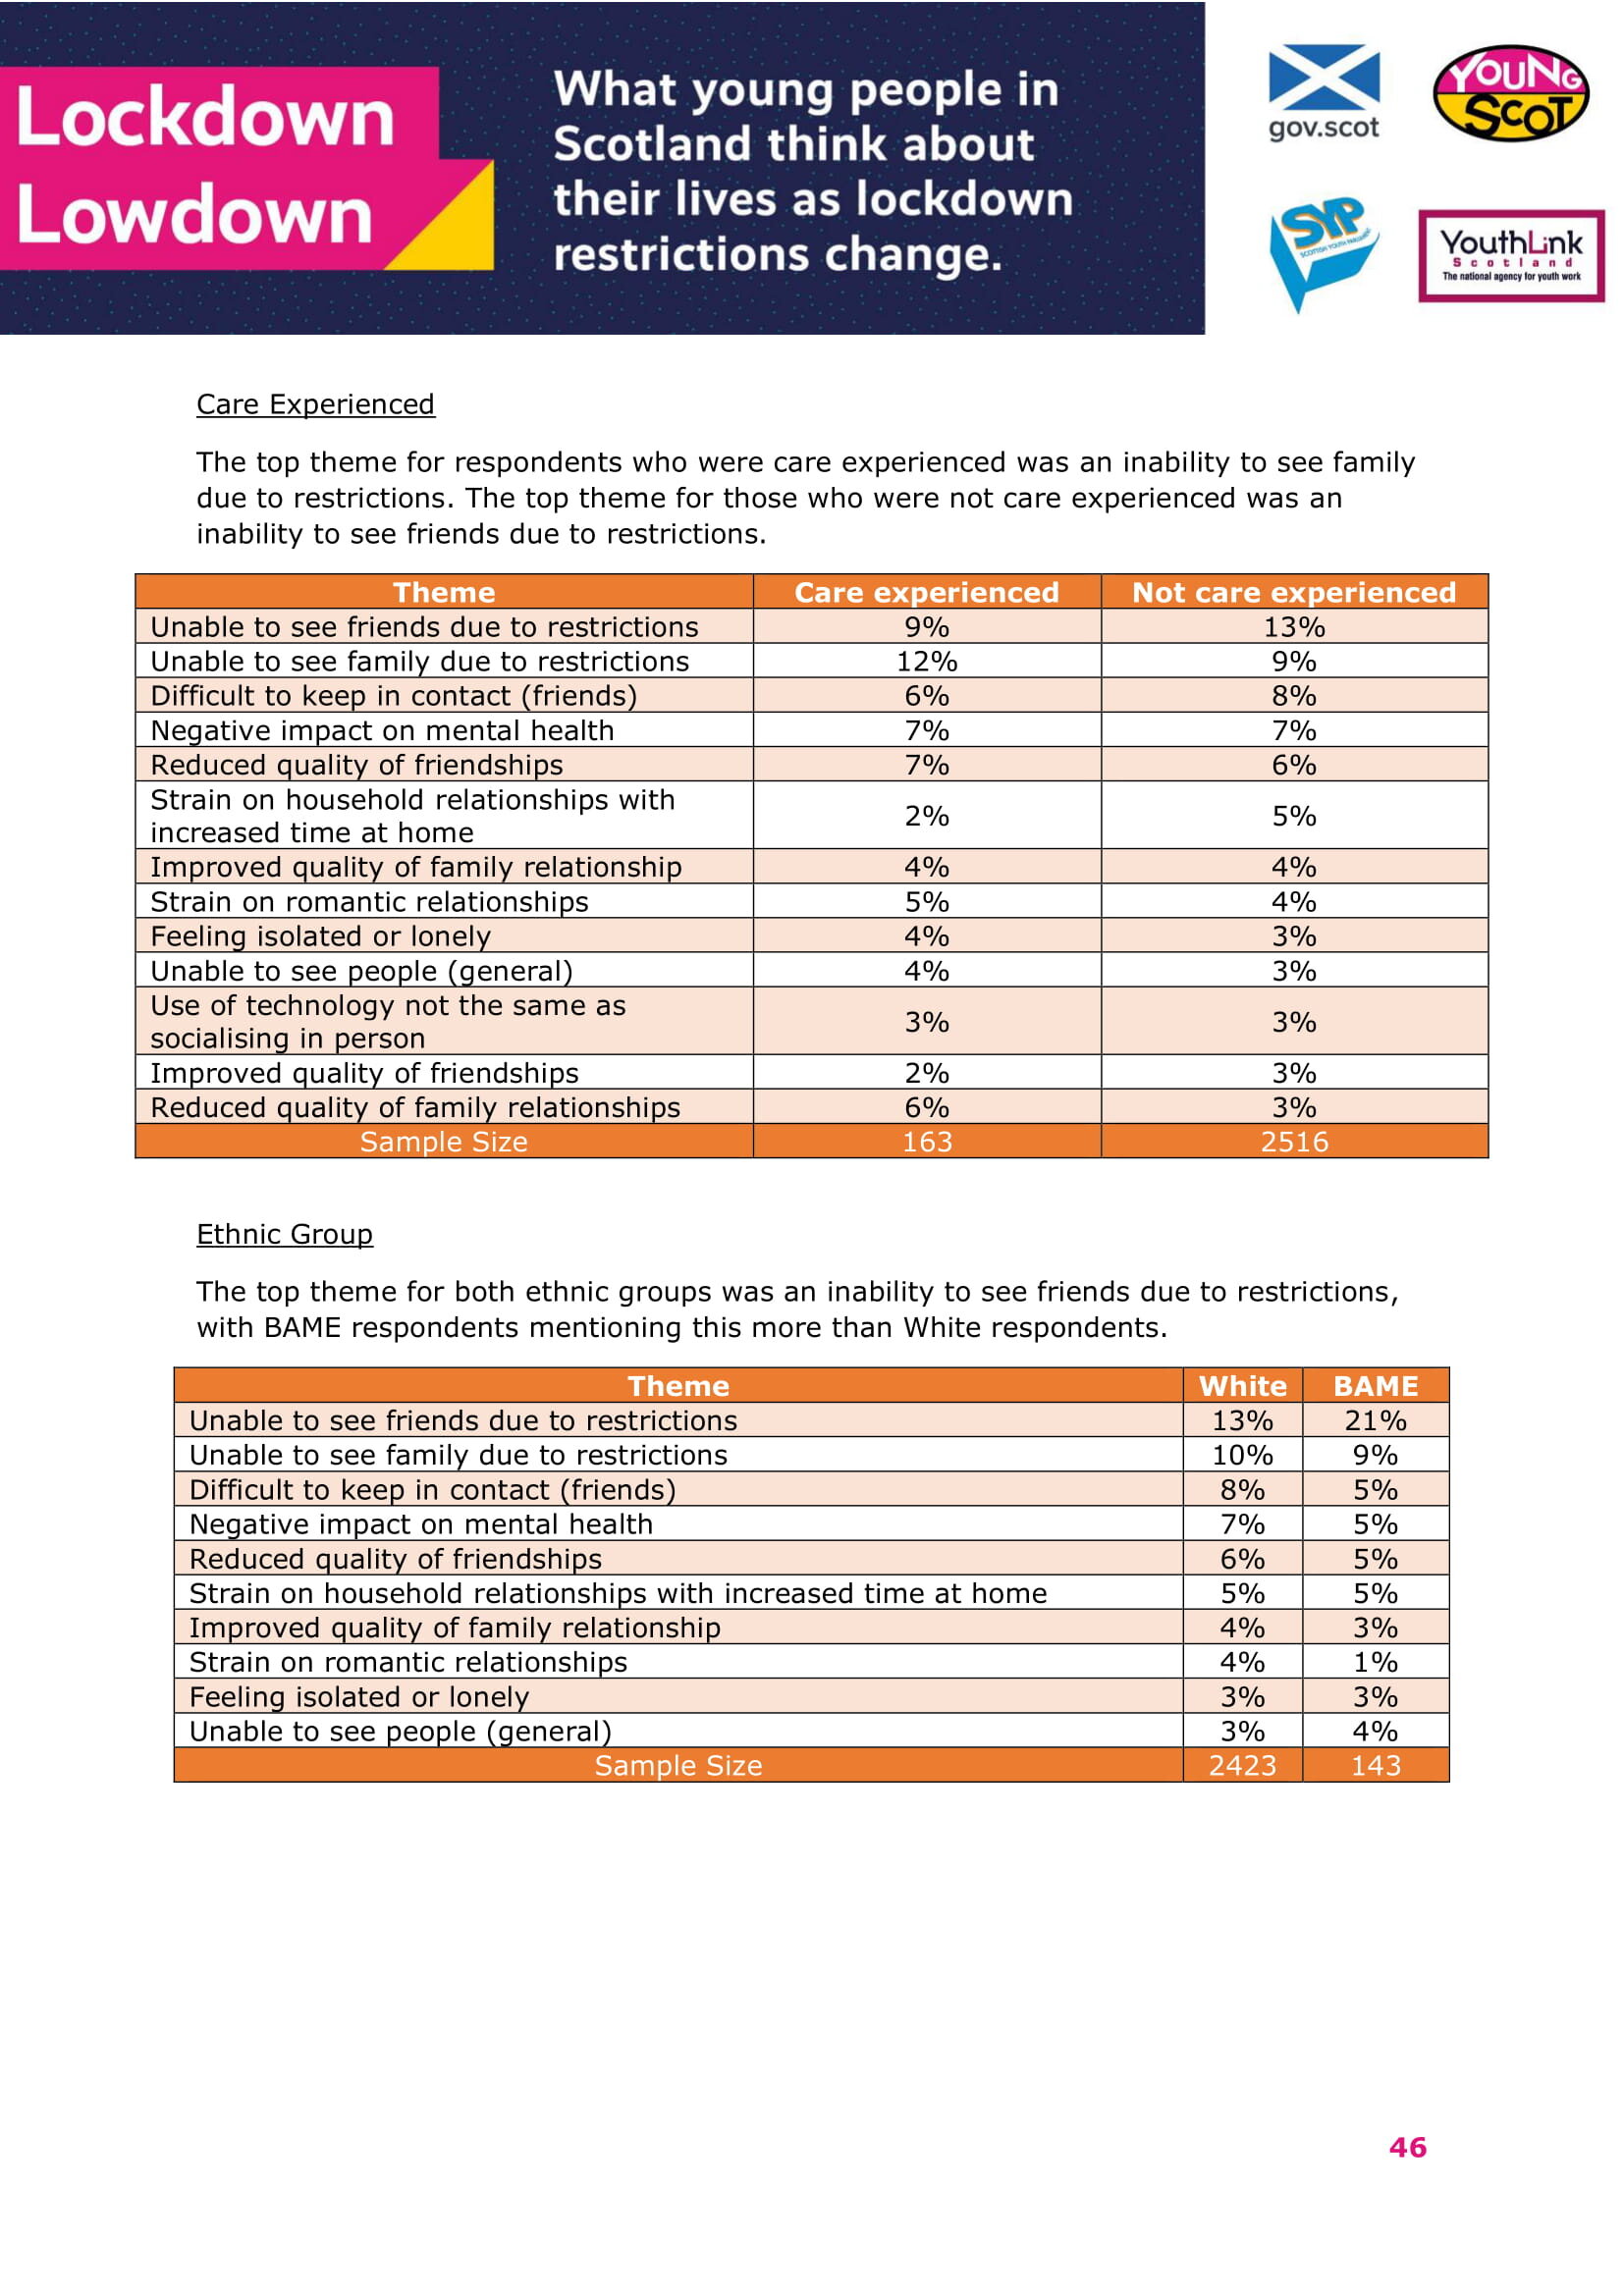
• When asked for any further thoughts on relationships, the most common theme for respondents who were care experienced was expressing inability to see family due to restrictions. For respondents who were not care experienced, the most prominent theme was the inability to see friends due to restrictions. This was a qualitative question with fewer responses compared to others.
Impact of coronavirus on employment
• Respondents who were care experienced were slightly more likely to agree that they felt good about their future employment prospects than those who were not (37% of respondents who were care experienced compared with 32% who were not).
Impact of coronavirus generally (including mental and physical health)
• Respondents who were care experienced were less likely to say that they felt good about their physical health and wellbeing than the other group (49% of respondents who were care experienced compared with 60% who were not).
• Respondents who were care experienced were less likely to that they felt good about their mental health and wellbeing than the other group (34% of respondents who were care experienced compared with 42% who were not).
• In terms of feeling able to access their rights as a young person, respondents who were care experienced agreed with this statement slightly less than those who were not (59% of respondents who were care experienced compared with 64% who were not).
• Respondents who were care experienced were not as concerned about transmitting coronavirus as respondents who were not (58% of respondents who were care experienced agreed that they were concerned compared with 65% who were not).
Access to information
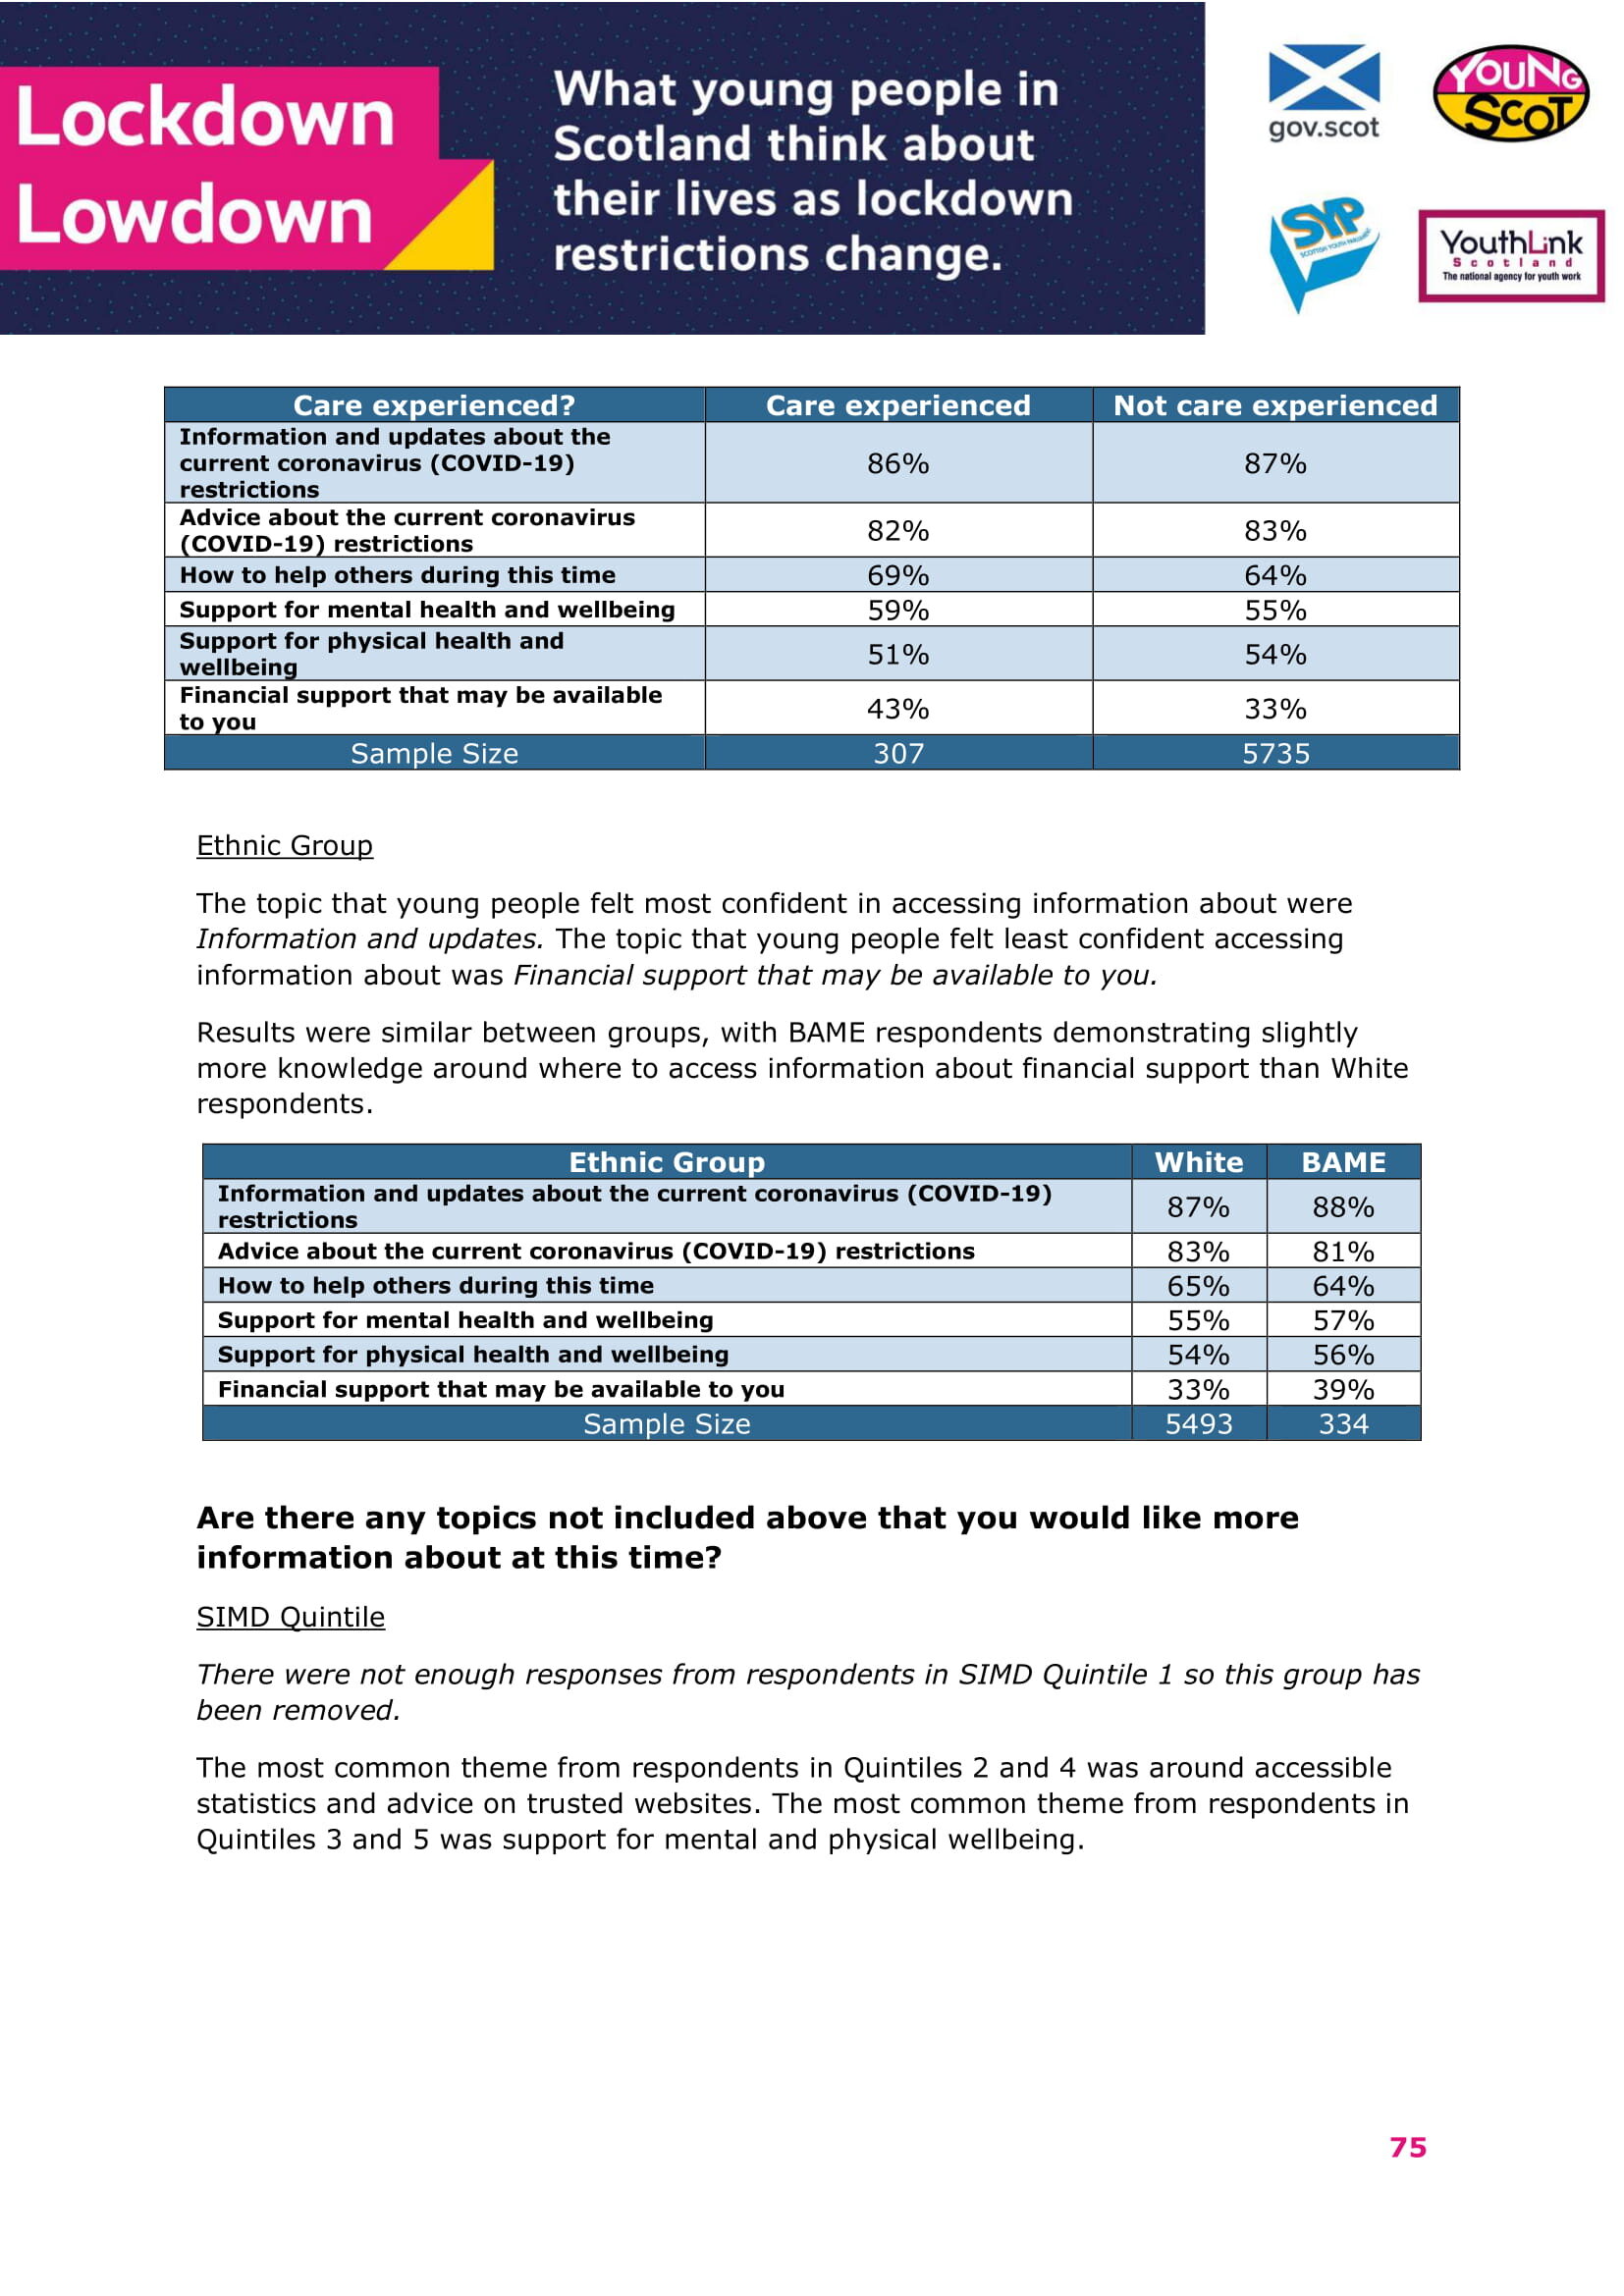
• Care experienced respondents were more likely to that they knew how to access information around financial support than respondents who were not. (43% of respondents who were care experienced compared with 33% who were not).
• The majority of both groups stated that they had access to a personal device that could connect online. Respondents who were care experienced were slightly less likely to have access than others (93% of respondents who were young carers compared with 97% who were not).
• The majority of both groups stated that they had access to a device within their local community that could connect online. Respondents who were care experienced were slightly less likely to have access compared to those who were not (81% of respondents who were young carers compared with 86% who were not).
Key Findings: Ethnic Group
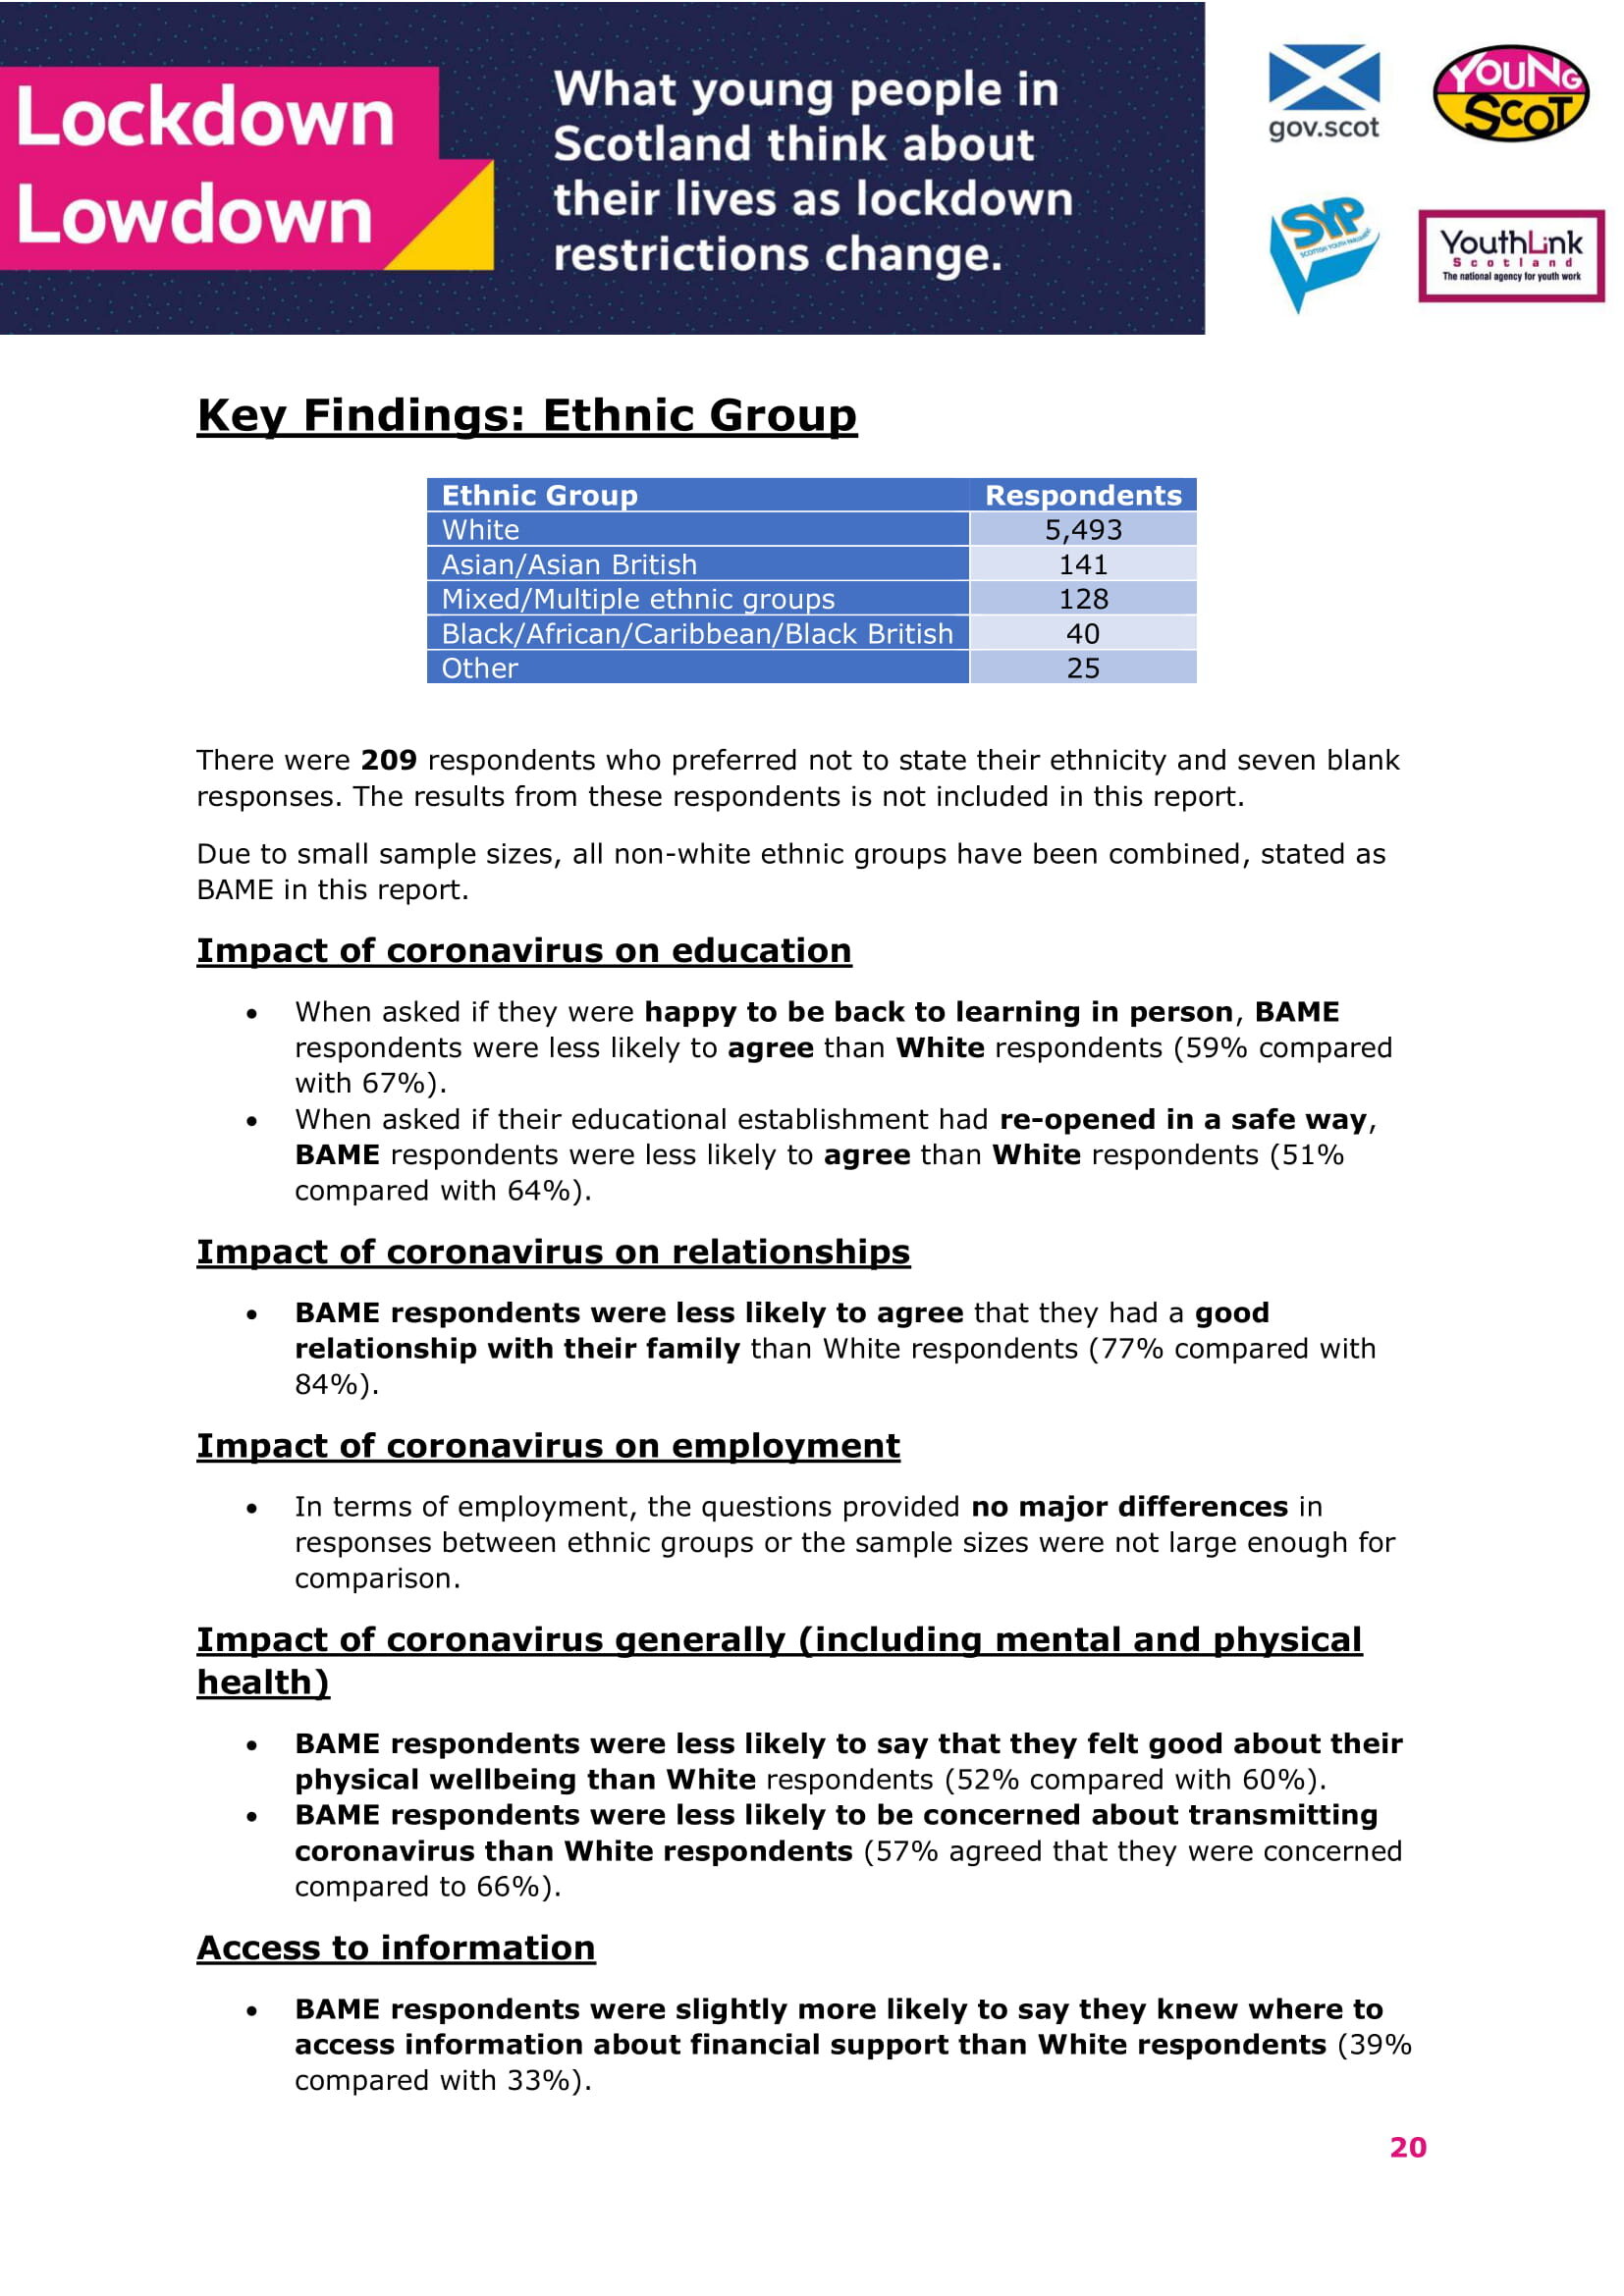
Ethnic Group Respondents
White 5,493
Asian/Asian British 141
Mixed/Multiple ethnic groups 128
Black/African/Caribbean/Black British 40
Other 25
There were 209 respondents who preferred not to state their ethnicity and seven blank responses. The results from these respondents is not included in this report.
Due to small sample sizes, all non-white ethnic groups have been combined, stated as BAME in this report.
Impact of coronavirus on education
• When asked if they were happy to be back to learning in person, BAME respondents were less likely to agree than White respondents (59% compared with 67%).
• When asked if their educational establishment had re-opened in a safe way, BAME respondents were less likely to agree than White respondents (51% compared with 64%).
Impact of coronavirus on relationships
• BAME respondents were less likely to agree that they had a good relationship with their family than White respondents (77% compared with 84%).
Impact of coronavirus on employment
• In terms of employment, the questions provided no major differences in responses between ethnic groups or the sample sizes were not large enough for comparison.
Impact of coronavirus generally (including mental and physical health)
• BAME respondents were less likely to say that they felt good about their physical wellbeing than White respondents (52% compared with 60%).
• BAME respondents were less likely to be concerned about transmitting coronavirus than White respondents (57% agreed that they were concerned compared to 66%).
Access to information
• BAME respondents were slightly more likely to say they knew where to access information about financial support than White respondents (39% compared with 33%).
• White respondents were slightly less likely to have access to a community online device than BAME respondents (86% compared with 90%).
Key Findings: Current level of education
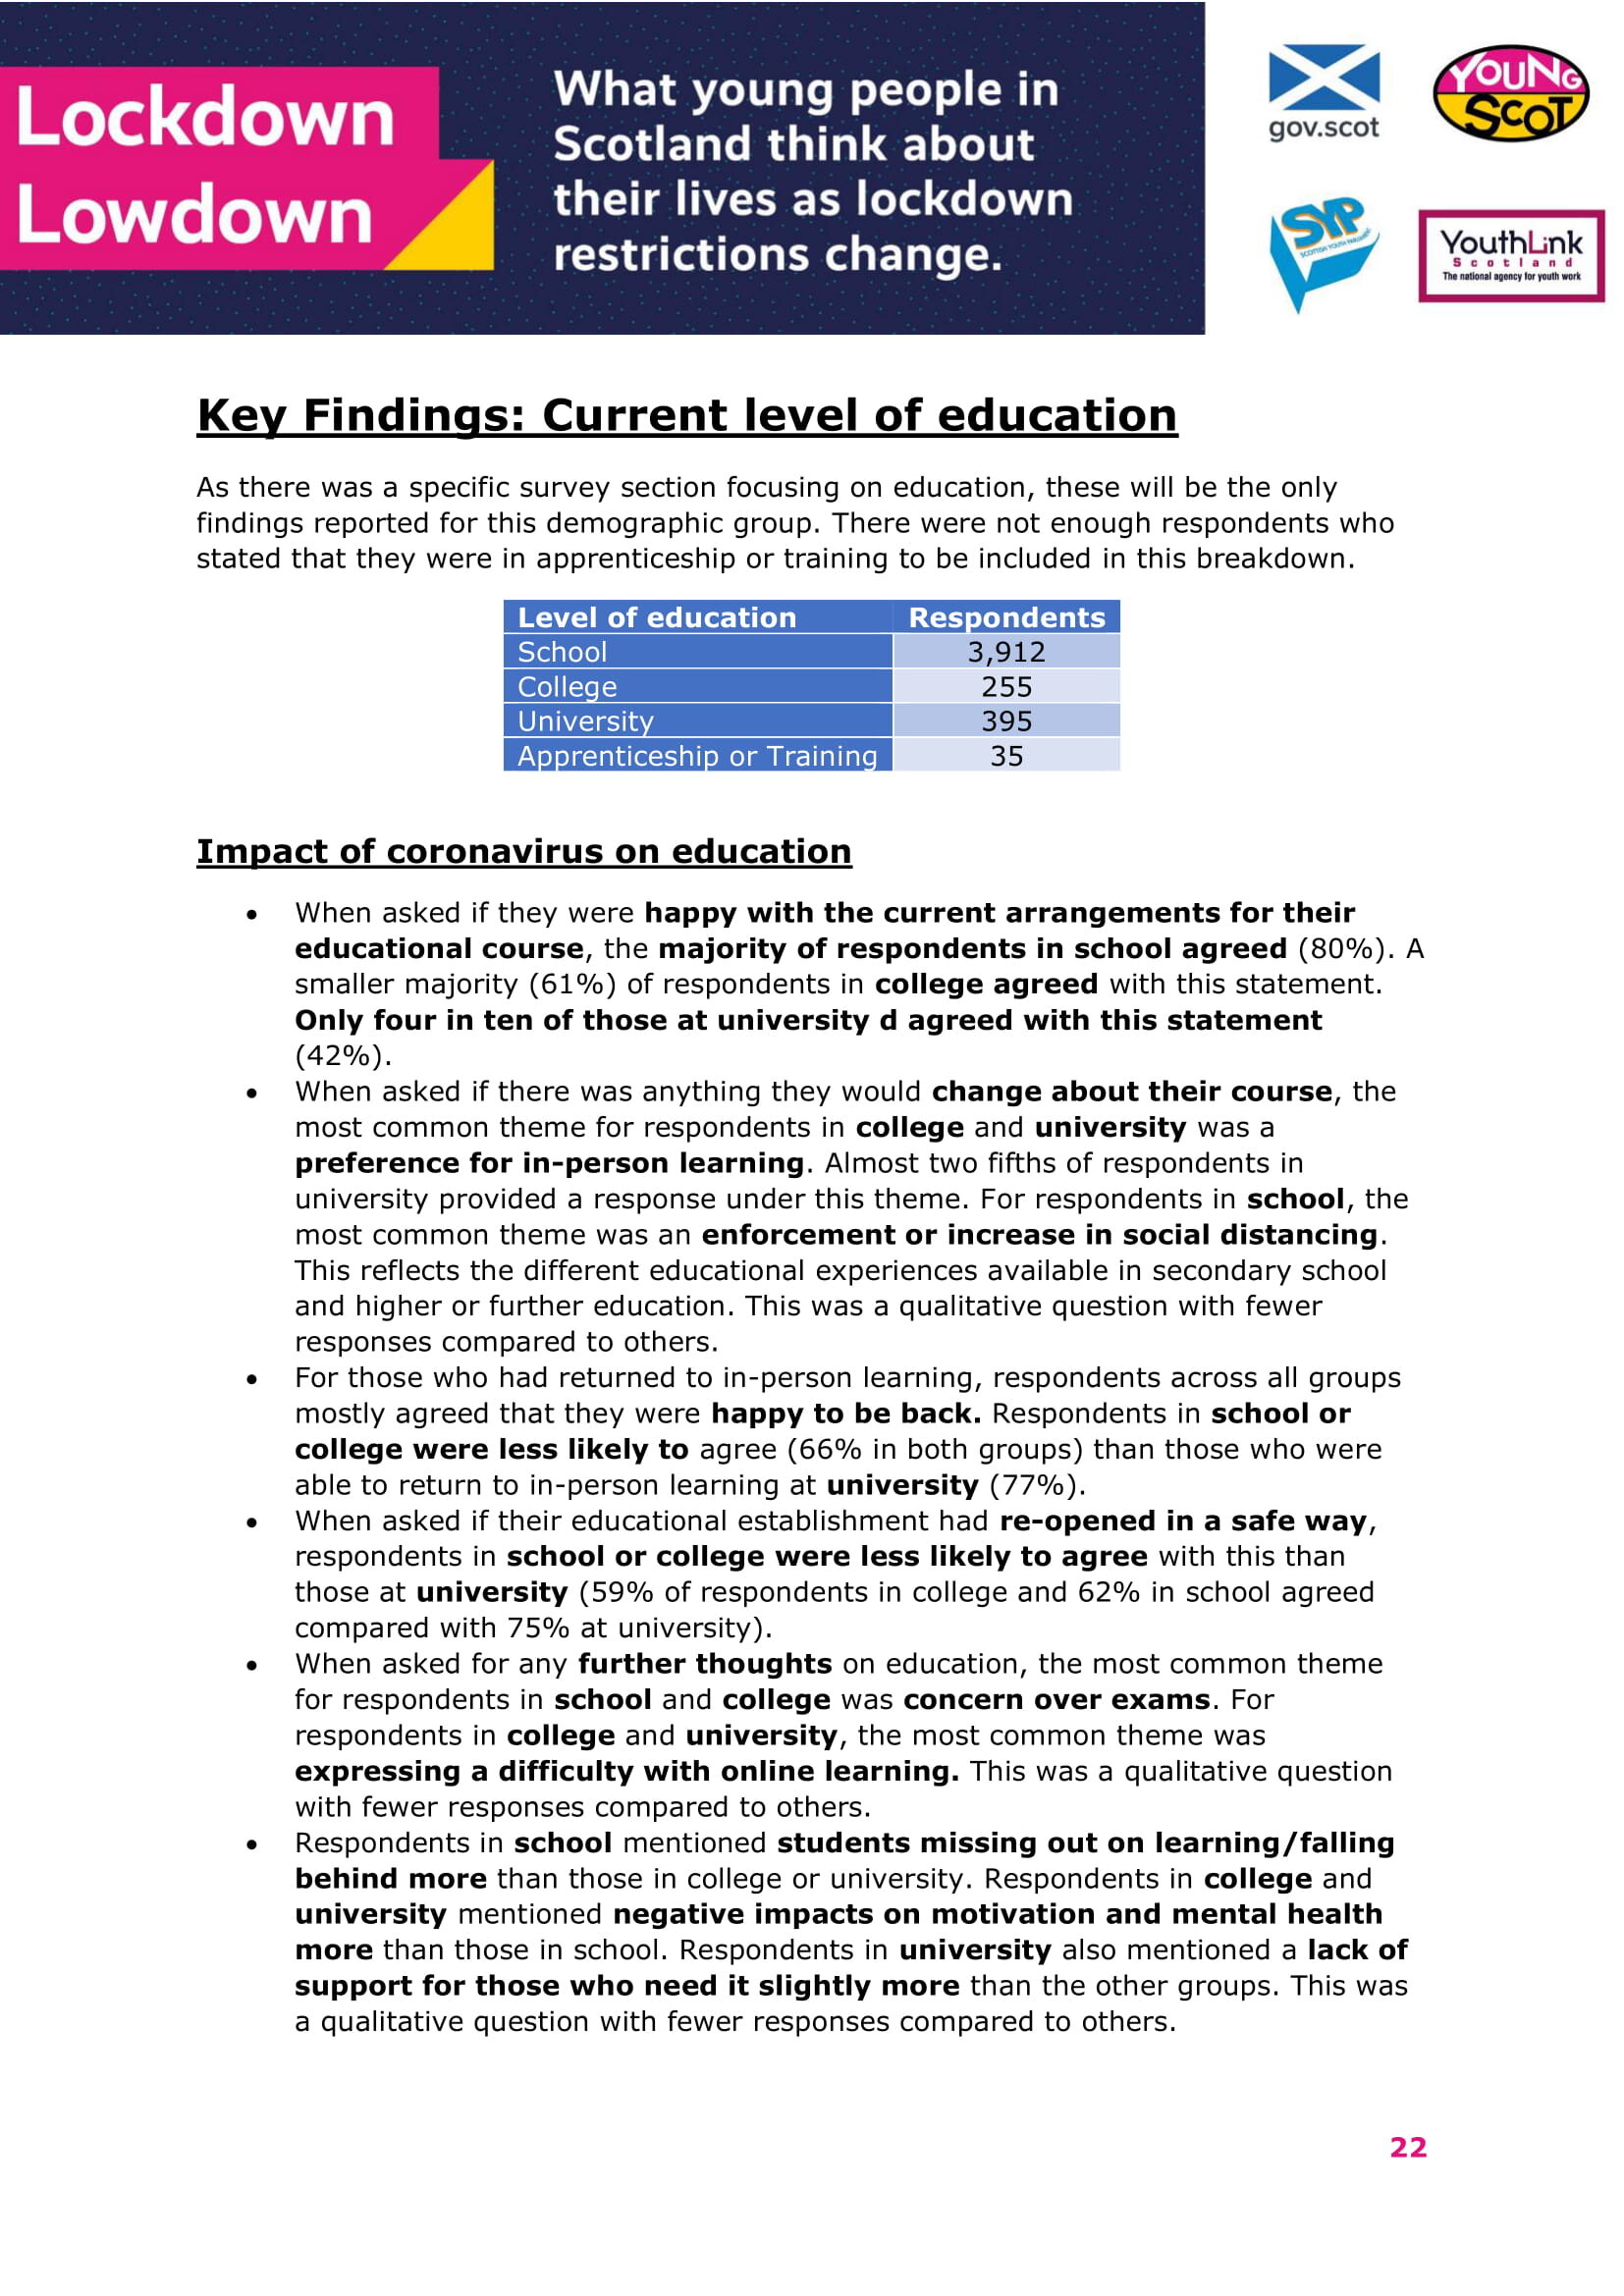
As there was a specific survey section focusing on education, these will be the only findings reported for this demographic group. There were not enough respondents who stated that they were in apprenticeship or training to be included in this breakdown.
Level of education Respondents
School 3,912
College 255
University 395
Apprenticeship or Training 35
Impact of coronavirus on education
• When asked if they were happy with the current arrangements for their educational course, the majority of respondents in school agreed (80%). A smaller majority (61%) of respondents in college agreed with this statement. Only four in ten of those at university d agreed with this statement (42%).
• When asked if there was anything they would change about their course, the most common theme for respondents in college and university was a preference for in-person learning. Almost two fifths of respondents in university provided a response under this theme. For respondents in school, the most common theme was an enforcement or increase in social distancing. This reflects the different educational experiences available in secondary school and higher or further education. This was a qualitative question with fewer responses compared to others.
• For those who had returned to in-person learning, respondents across all groups mostly agreed that they were happy to be back. Respondents in school or college were less likely to agree (66% in both groups) than those who were able to return to in-person learning at university (77%).
• When asked if their educational establishment had re-opened in a safe way, respondents in school or college were less likely to agree with this than those at university (59% of respondents in college and 62% in school agreed compared with 75% at university).
• When asked for any further thoughts on education, the most common theme for respondents in school and college was concern over exams. For respondents in college and university, the most common theme was expressing a difficulty with online learning. This was a qualitative question with fewer responses compared to others.
• Respondents in school mentioned students missing out on learning/falling behind more than those in college or university. Respondents in college and university mentioned negative impacts on motivation and mental health more than those in school. Respondents in university also mentioned a lack of support for those who need it slightly more than the other groups. This was a qualitative question with fewer responses compared to others.
Key Findings: Employment Status
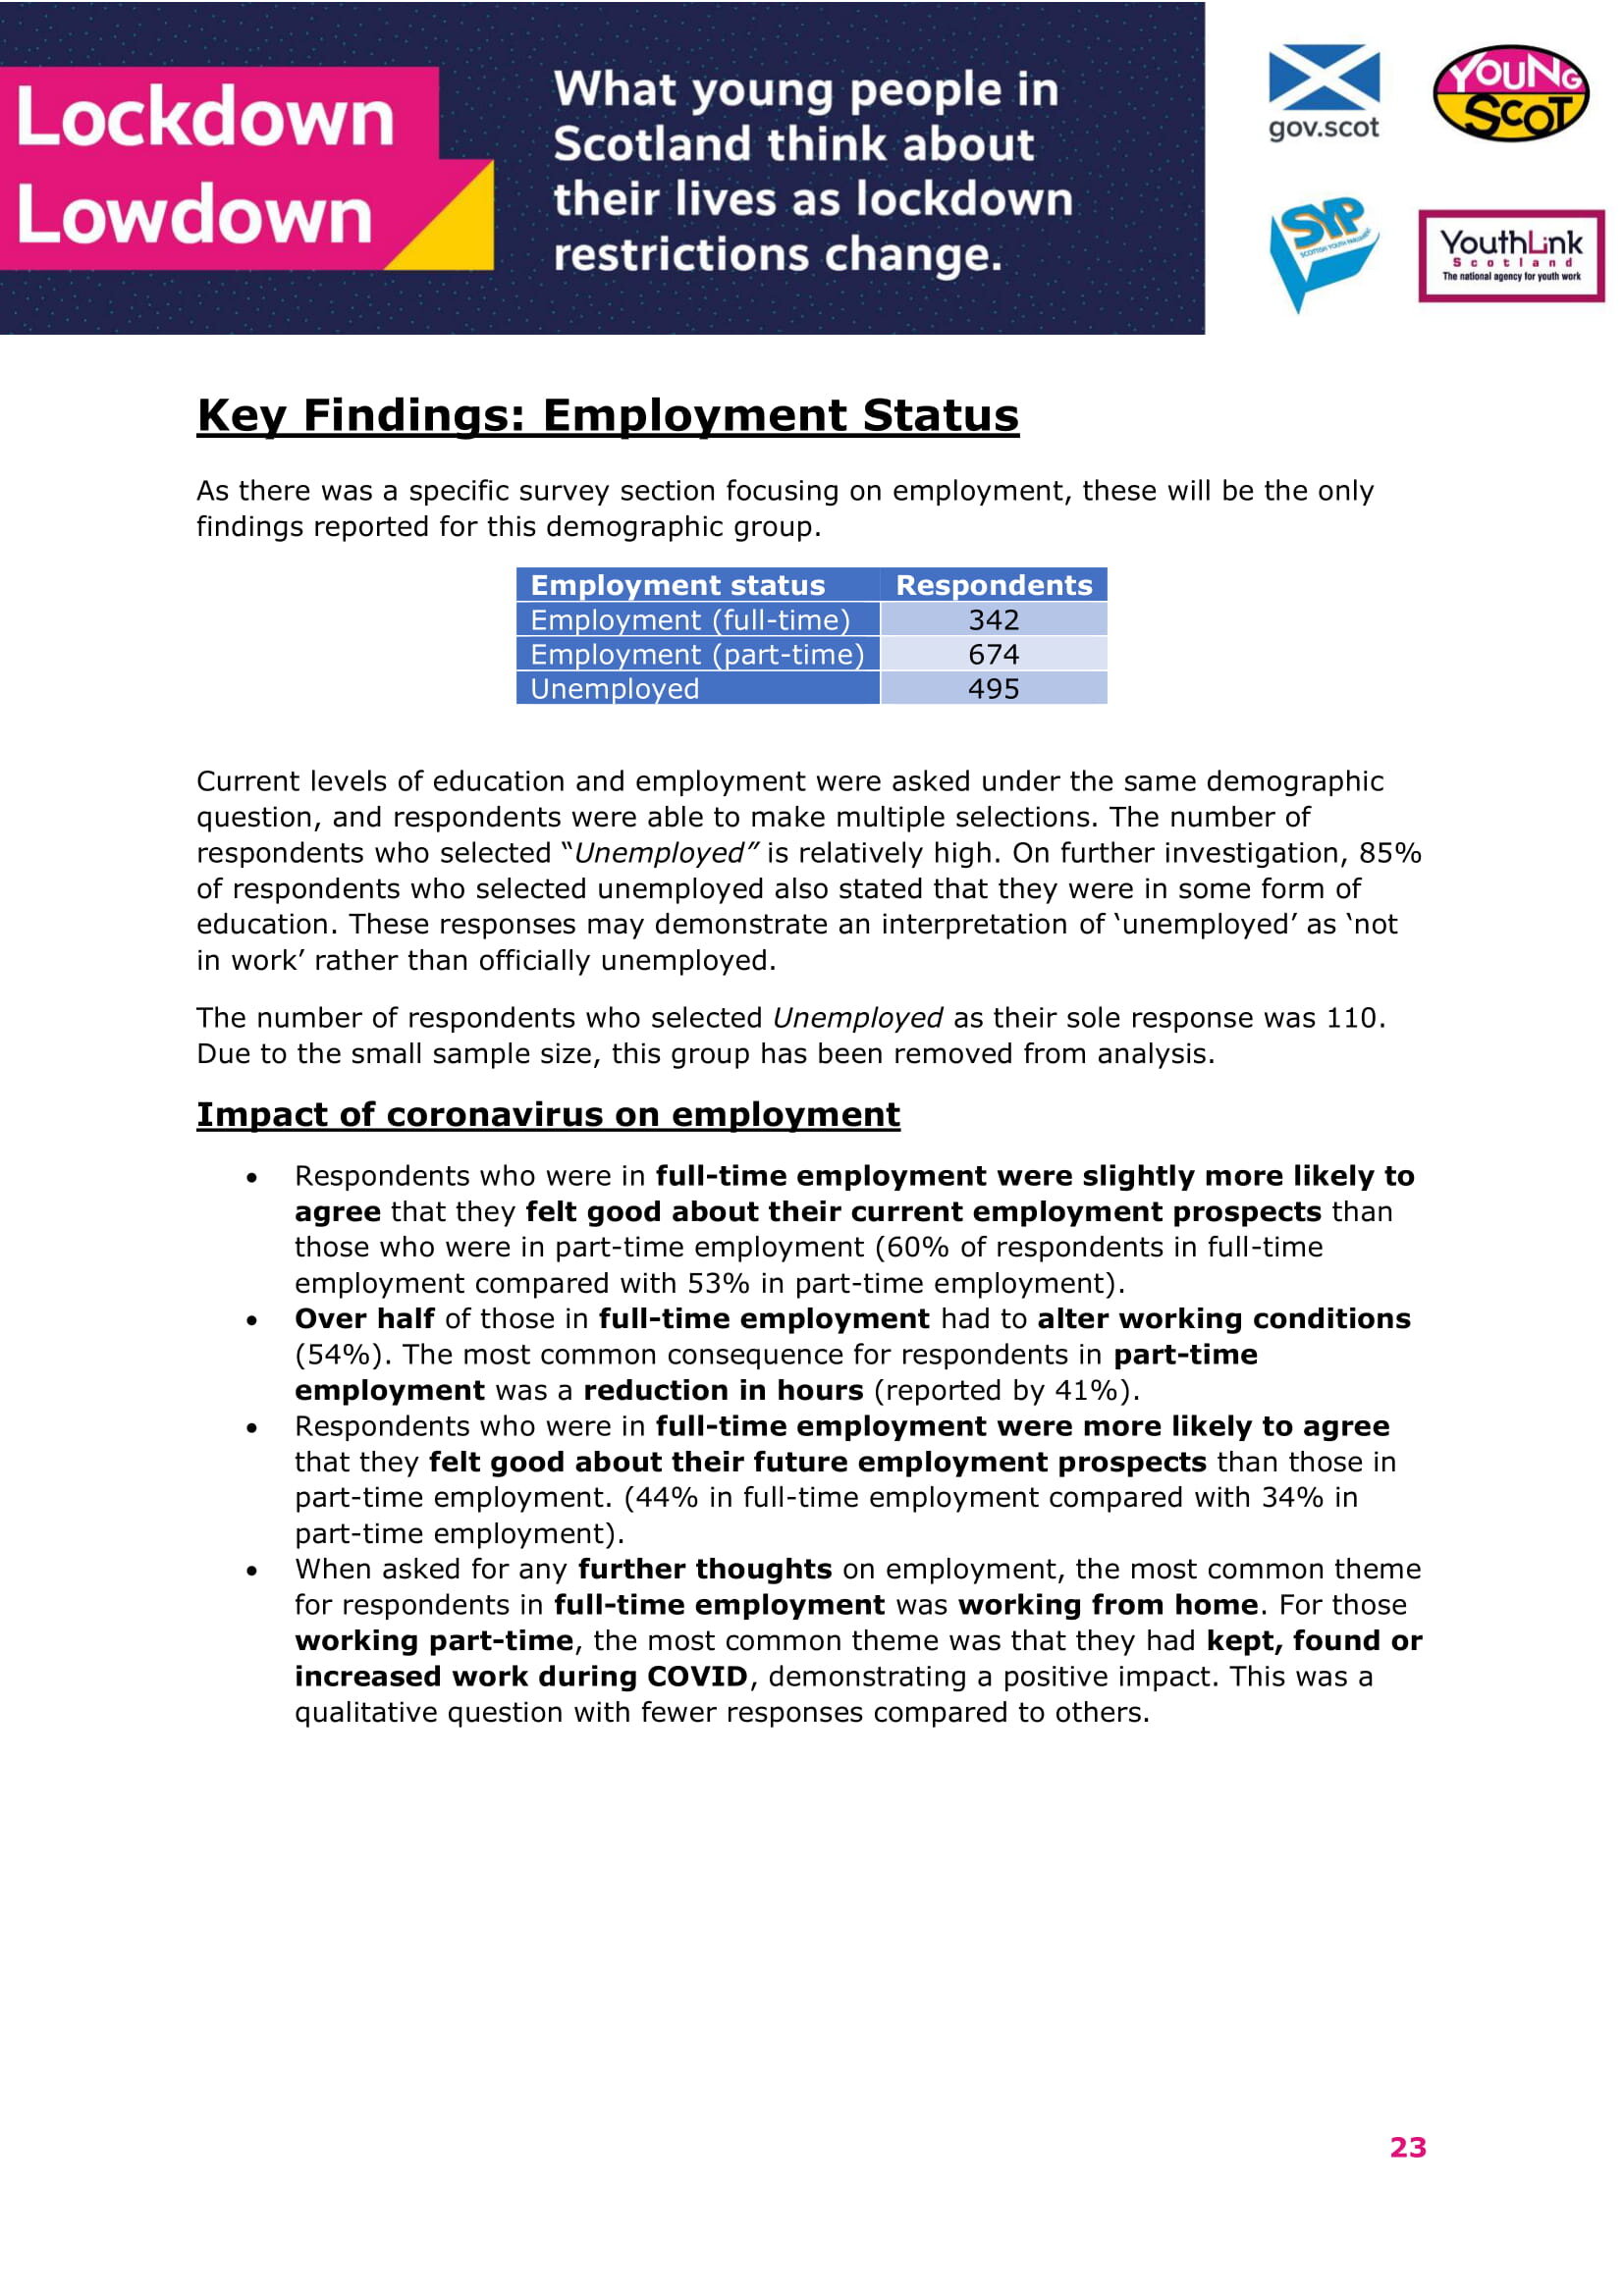
As there was a specific survey section focusing on employment, these will be the only findings reported for this demographic group.
Employment status Respondents
Employment (full-time) 342
Employment (part-time) 674
Unemployed 495
Current levels of education and employment were asked under the same demographic question, and respondents were able to make multiple selections. The number of respondents who selected “Unemployed” is relatively high. On further investigation, 85% of respondents who selected unemployed also stated that they were in some form of education. These responses may demonstrate an interpretation of ‘unemployed’ as ‘not in work’ rather than officially unemployed.
The number of respondents who selected Unemployed as their sole response was 110. Due to the small sample size, this group has been removed from analysis.
Impact of coronavirus on employment
• Respondents who were in full-time employment were slightly more likely to agree that they felt good about their current employment prospects than those who were in part-time employment (60% of respondents in full-time employment compared with 53% in part-time employment).
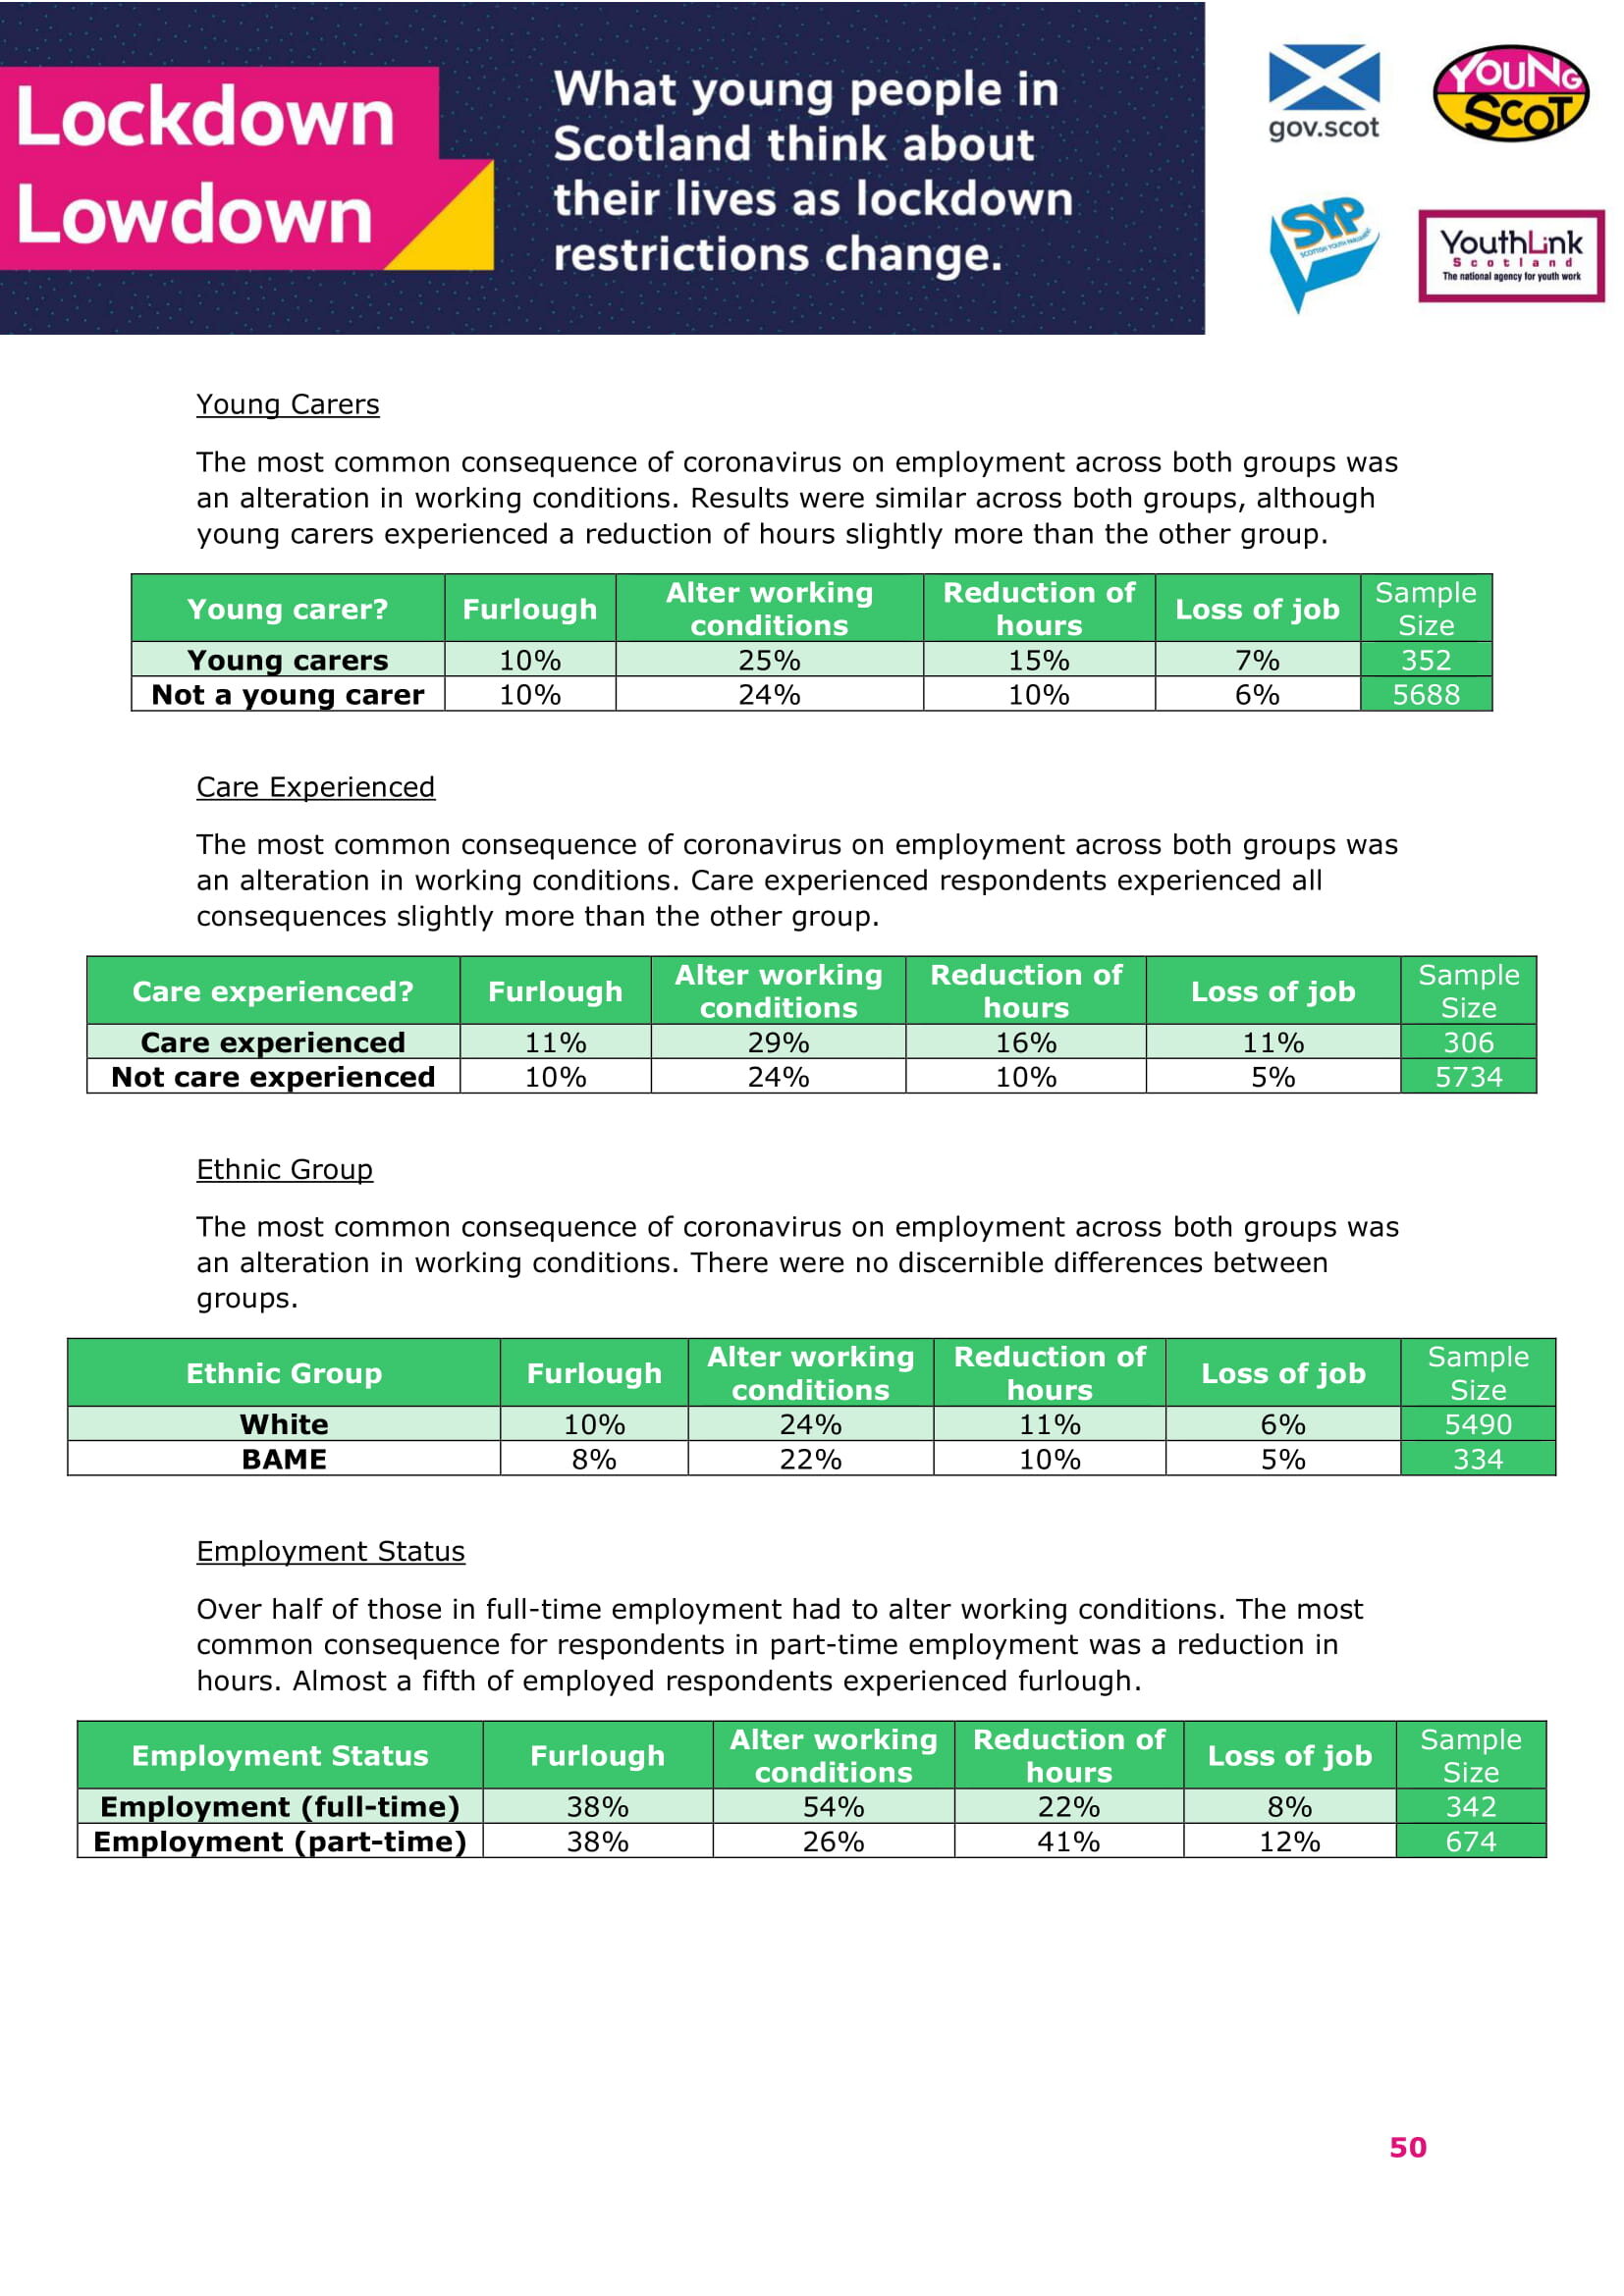
• Over half of those in full-time employment had to alter working conditions (54%). The most common consequence for respondents in part-time employment was a reduction in hours (reported by 41%).
• Respondents who were in full-time employment were more likely to agree that they felt good about their future employment prospects than those in part-time employment. (44% in full-time employment compared with 34% in part-time employment).
• When asked for any further thoughts on employment, the most common theme for respondents in full-time employment was working from home. For those working part-time, the most common theme was that they had kept, found or increased work during COVID, demonstrating a positive impact. This was a qualitative question with fewer responses compared to others.
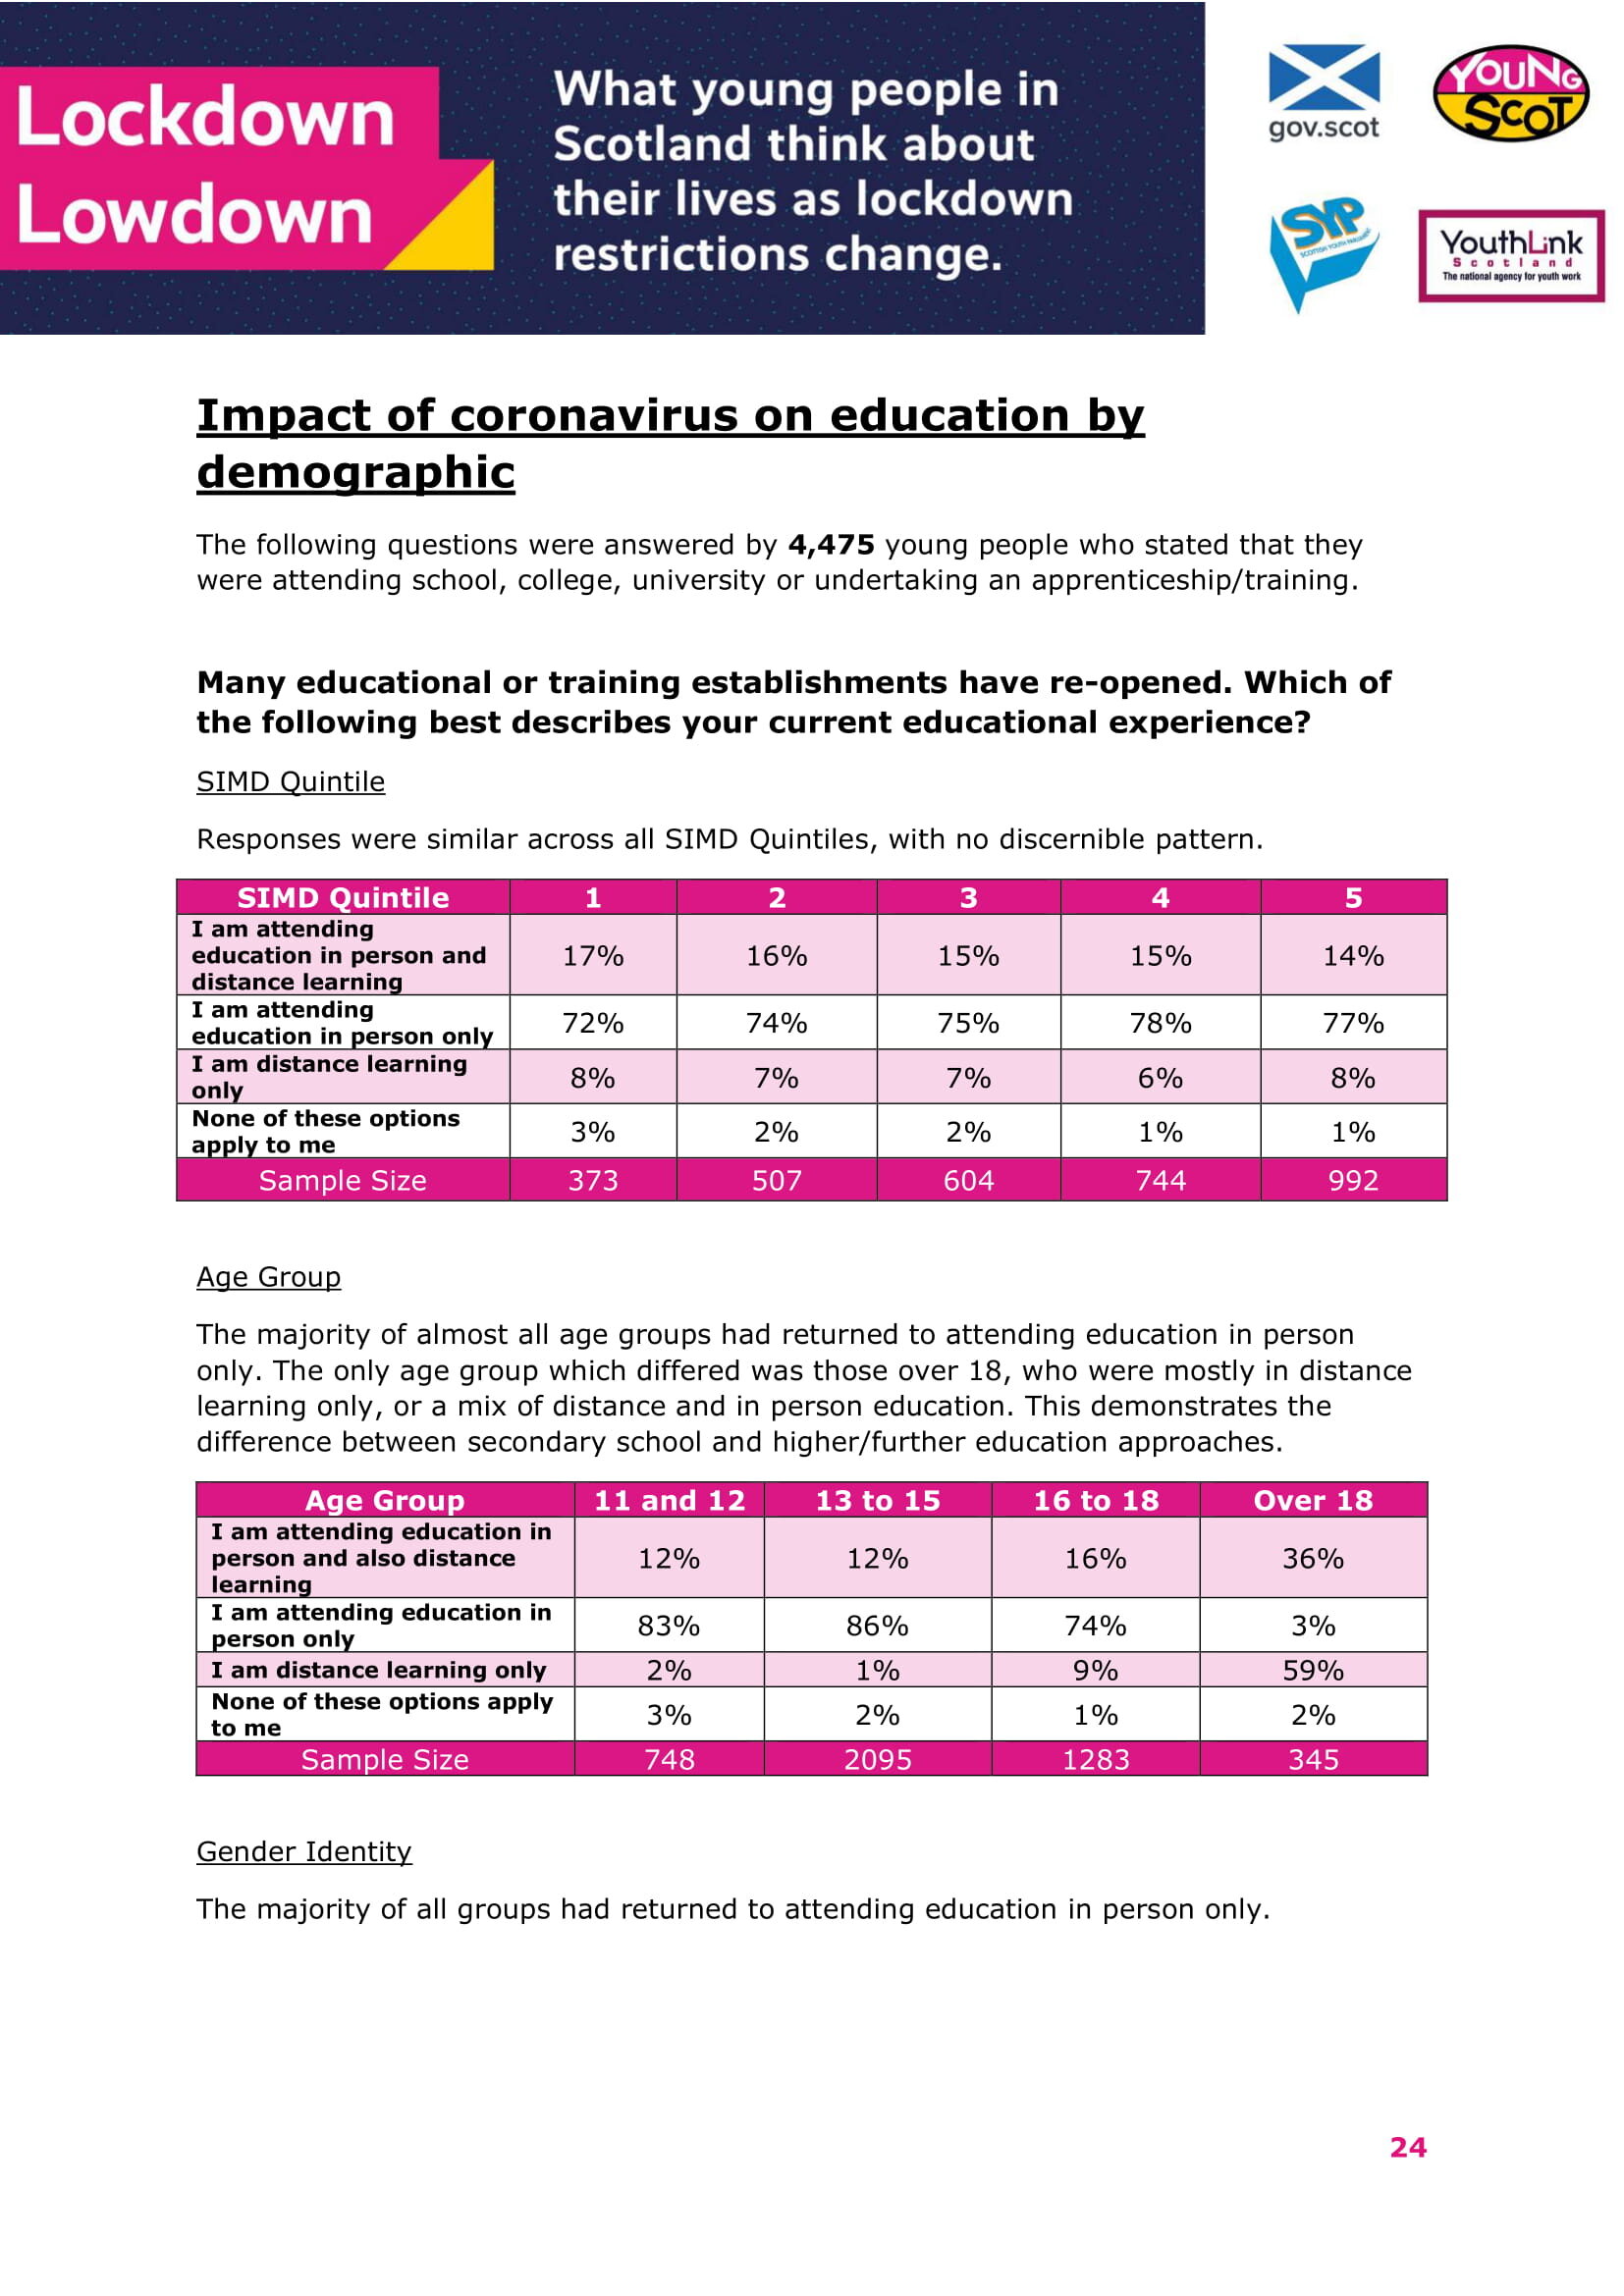
Impact of coronavirus on education by demographic
The following questions were answered by 4,475 young people who stated that they were attending school, college, university or undertaking an apprenticeship/training.
Many educational or training establishments have re-opened. Which of the following best describes your current educational experience?
SIMD Quintile
Responses were similar across all SIMD Quintiles, with no discernible pattern.
SIMD Quintile 1 2 3 4 5
I am attending education in person and distance learning 17% 16% 15% 15% 14%
I am attending education in person only 72% 74% 75% 78% 77%
I am distance learning only 8% 7% 7% 6% 8%
None of these options apply to me 3% 2% 2% 1% 1%
Sample Size 373 507 604 744 992
Age Group
The majority of almost all age groups had returned to attending education in person only. The only age group which differed was those over 18, who were mostly in distance learning only, or a mix of distance and in person education. This demonstrates the difference between secondary school and higher/further education approaches.
Age Group 11 and 12 13 to 15 16 to 18 Over 18
I am attending education in person and also distance learning 12% 12% 16% 36%
I am attending education in person only 83% 86% 74% 3%
I am distance learning only 2% 1% 9% 59%
None of these options apply to me 3% 2% 1% 2%
Sample Size 748 2095 1283 345
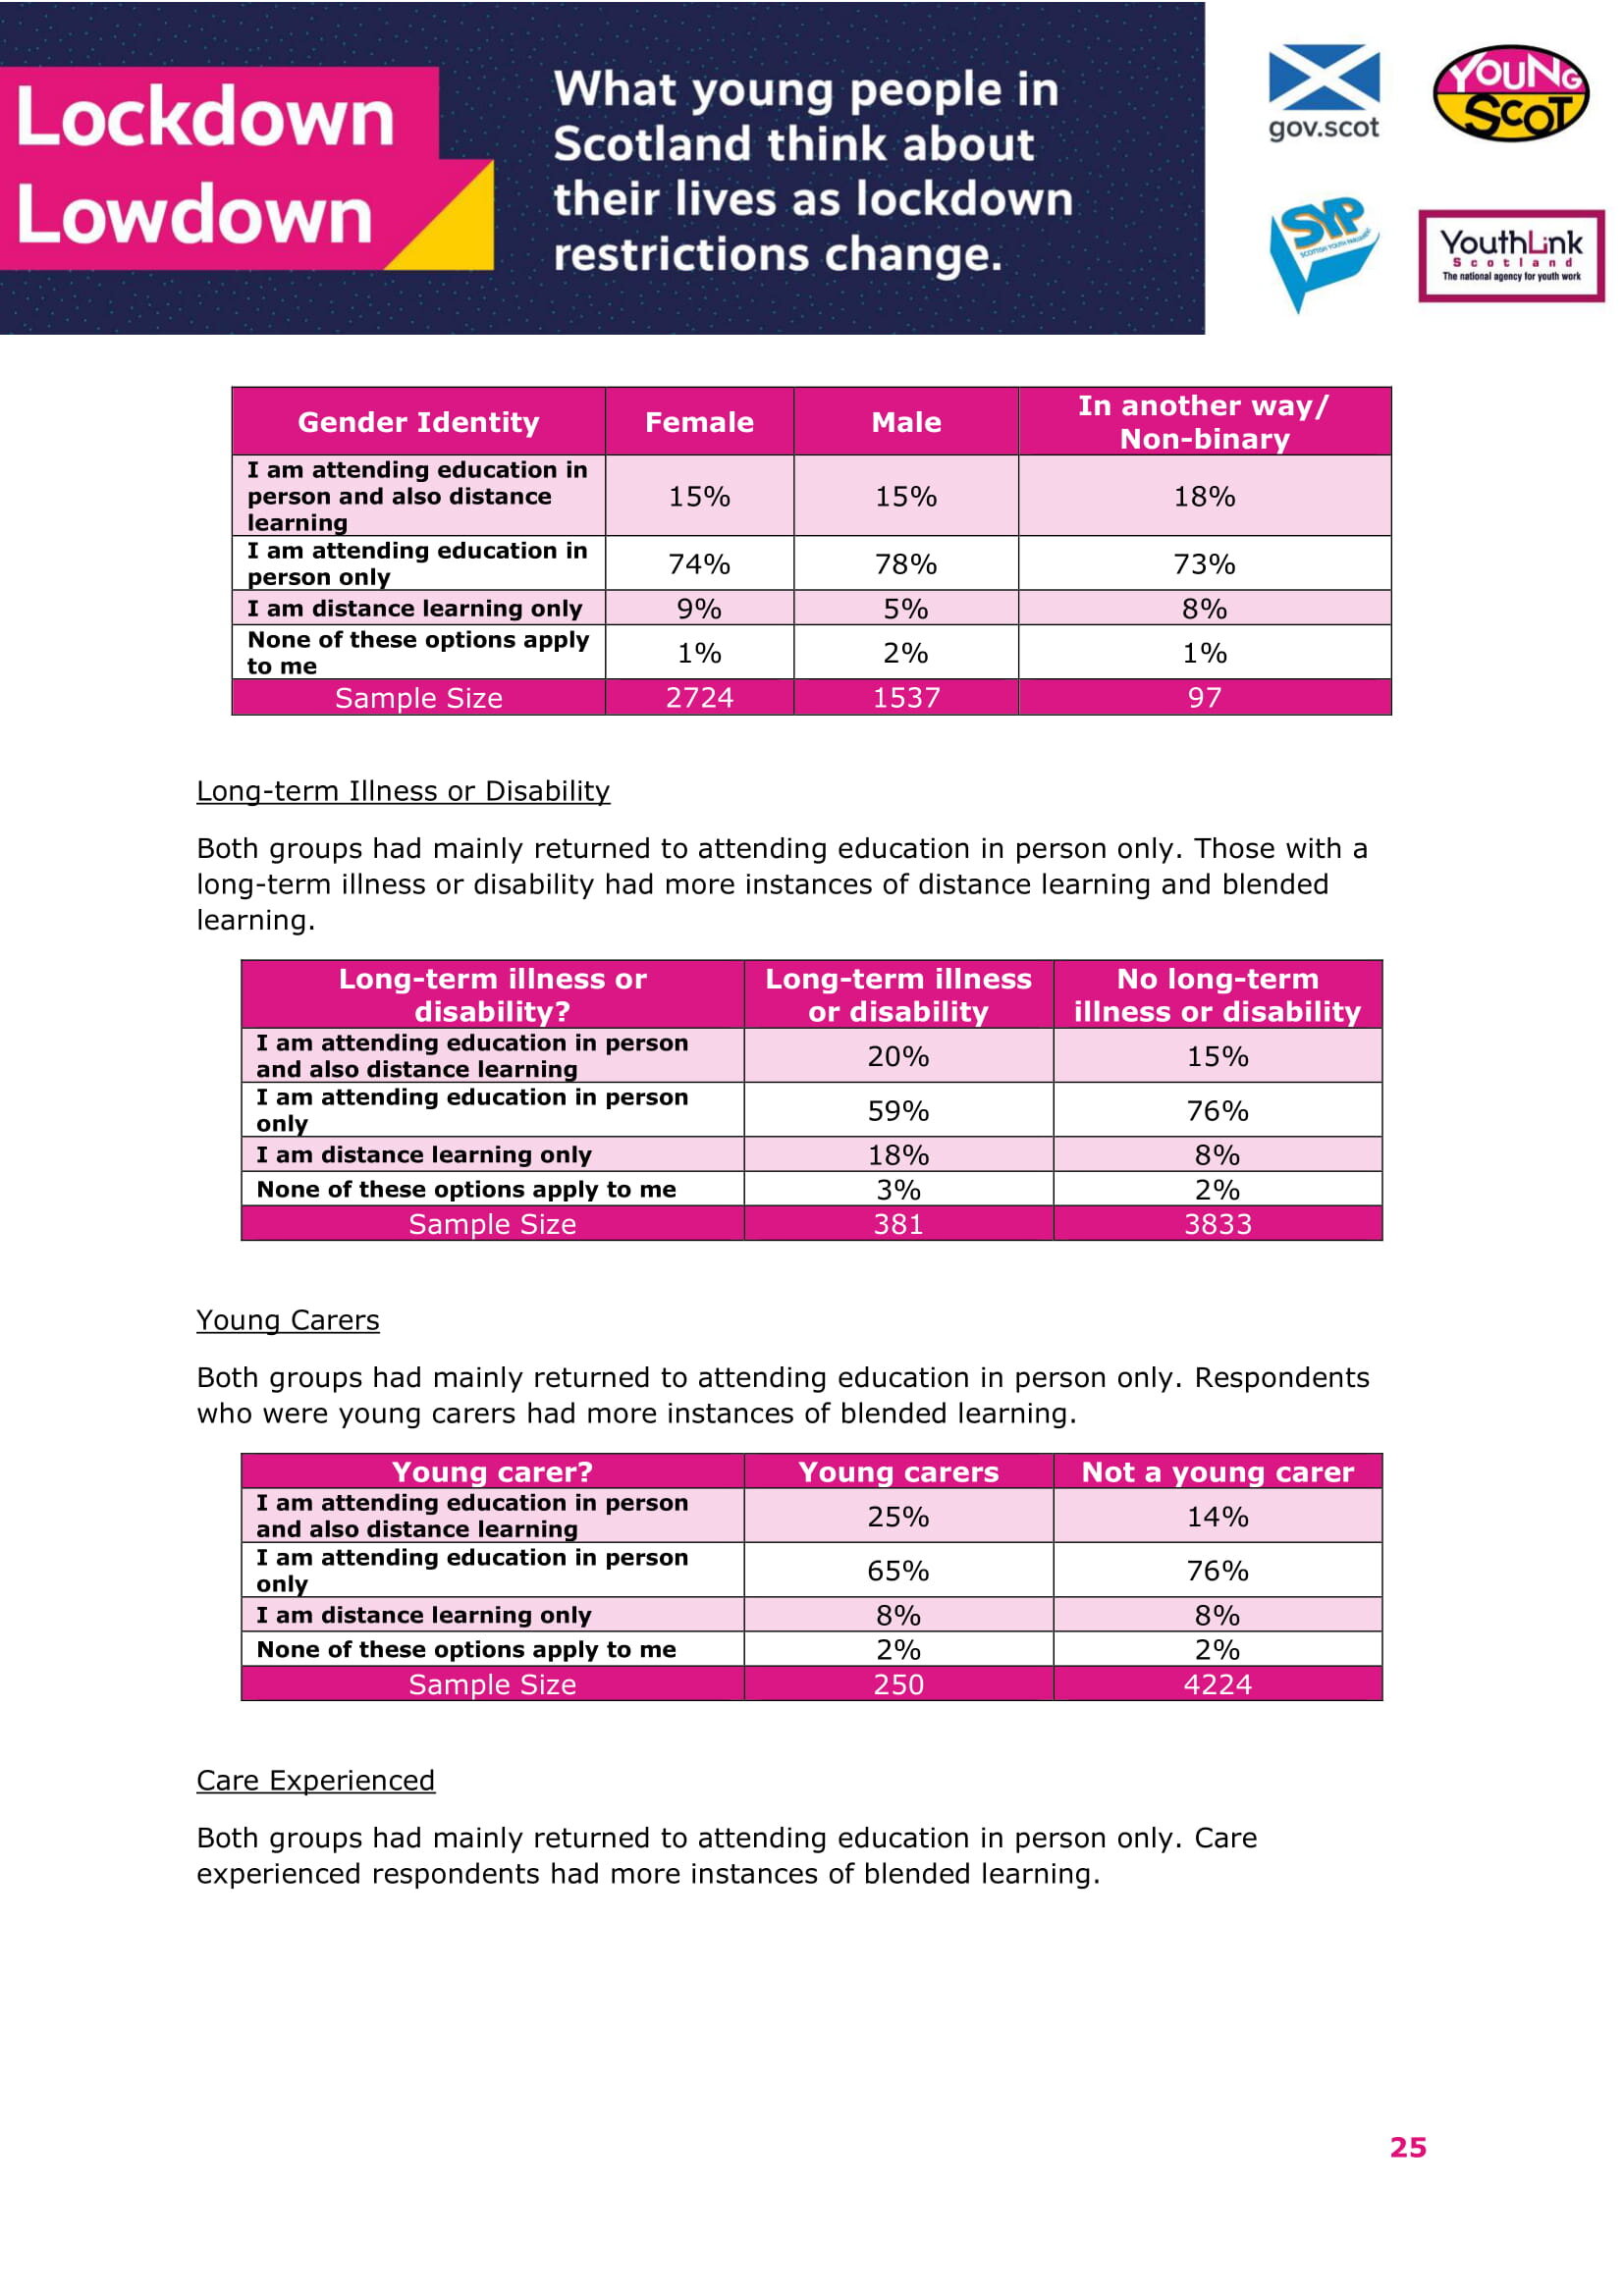
Gender Identity
The majority of all groups had returned to attending education in person only.
Gender Identity Female Male In another way/
Non-binary
I am attending education in person and also distance learning 15% 15% 18%
I am attending education in person only 74% 78% 73%
I am distance learning only 9% 5% 8%
None of these options apply to me 1% 2% 1%
Sample Size 2724 1537 97
Long-term Illness or Disability
Both groups had mainly returned to attending education in person only. Those with a long-term illness or disability had more instances of distance learning and blended learning.
Long-term illness or disability? Long-term illness or disability No long-term illness or disability
I am attending education in person and also distance learning 20% 15%
I am attending education in person only 59% 76%
I am distance learning only 18% 8%
None of these options apply to me 3% 2%
Sample Size 381 3833
Young Carers
Both groups had mainly returned to attending education in person only. Respondents who were young carers had more instances of blended learning.
Young carer? Young carers Not a young carer
I am attending education in person and also distance learning 25% 14%
I am attending education in person only 65% 76%
I am distance learning only 8% 8%
None of these options apply to me 2% 2%
Sample Size 250 4224
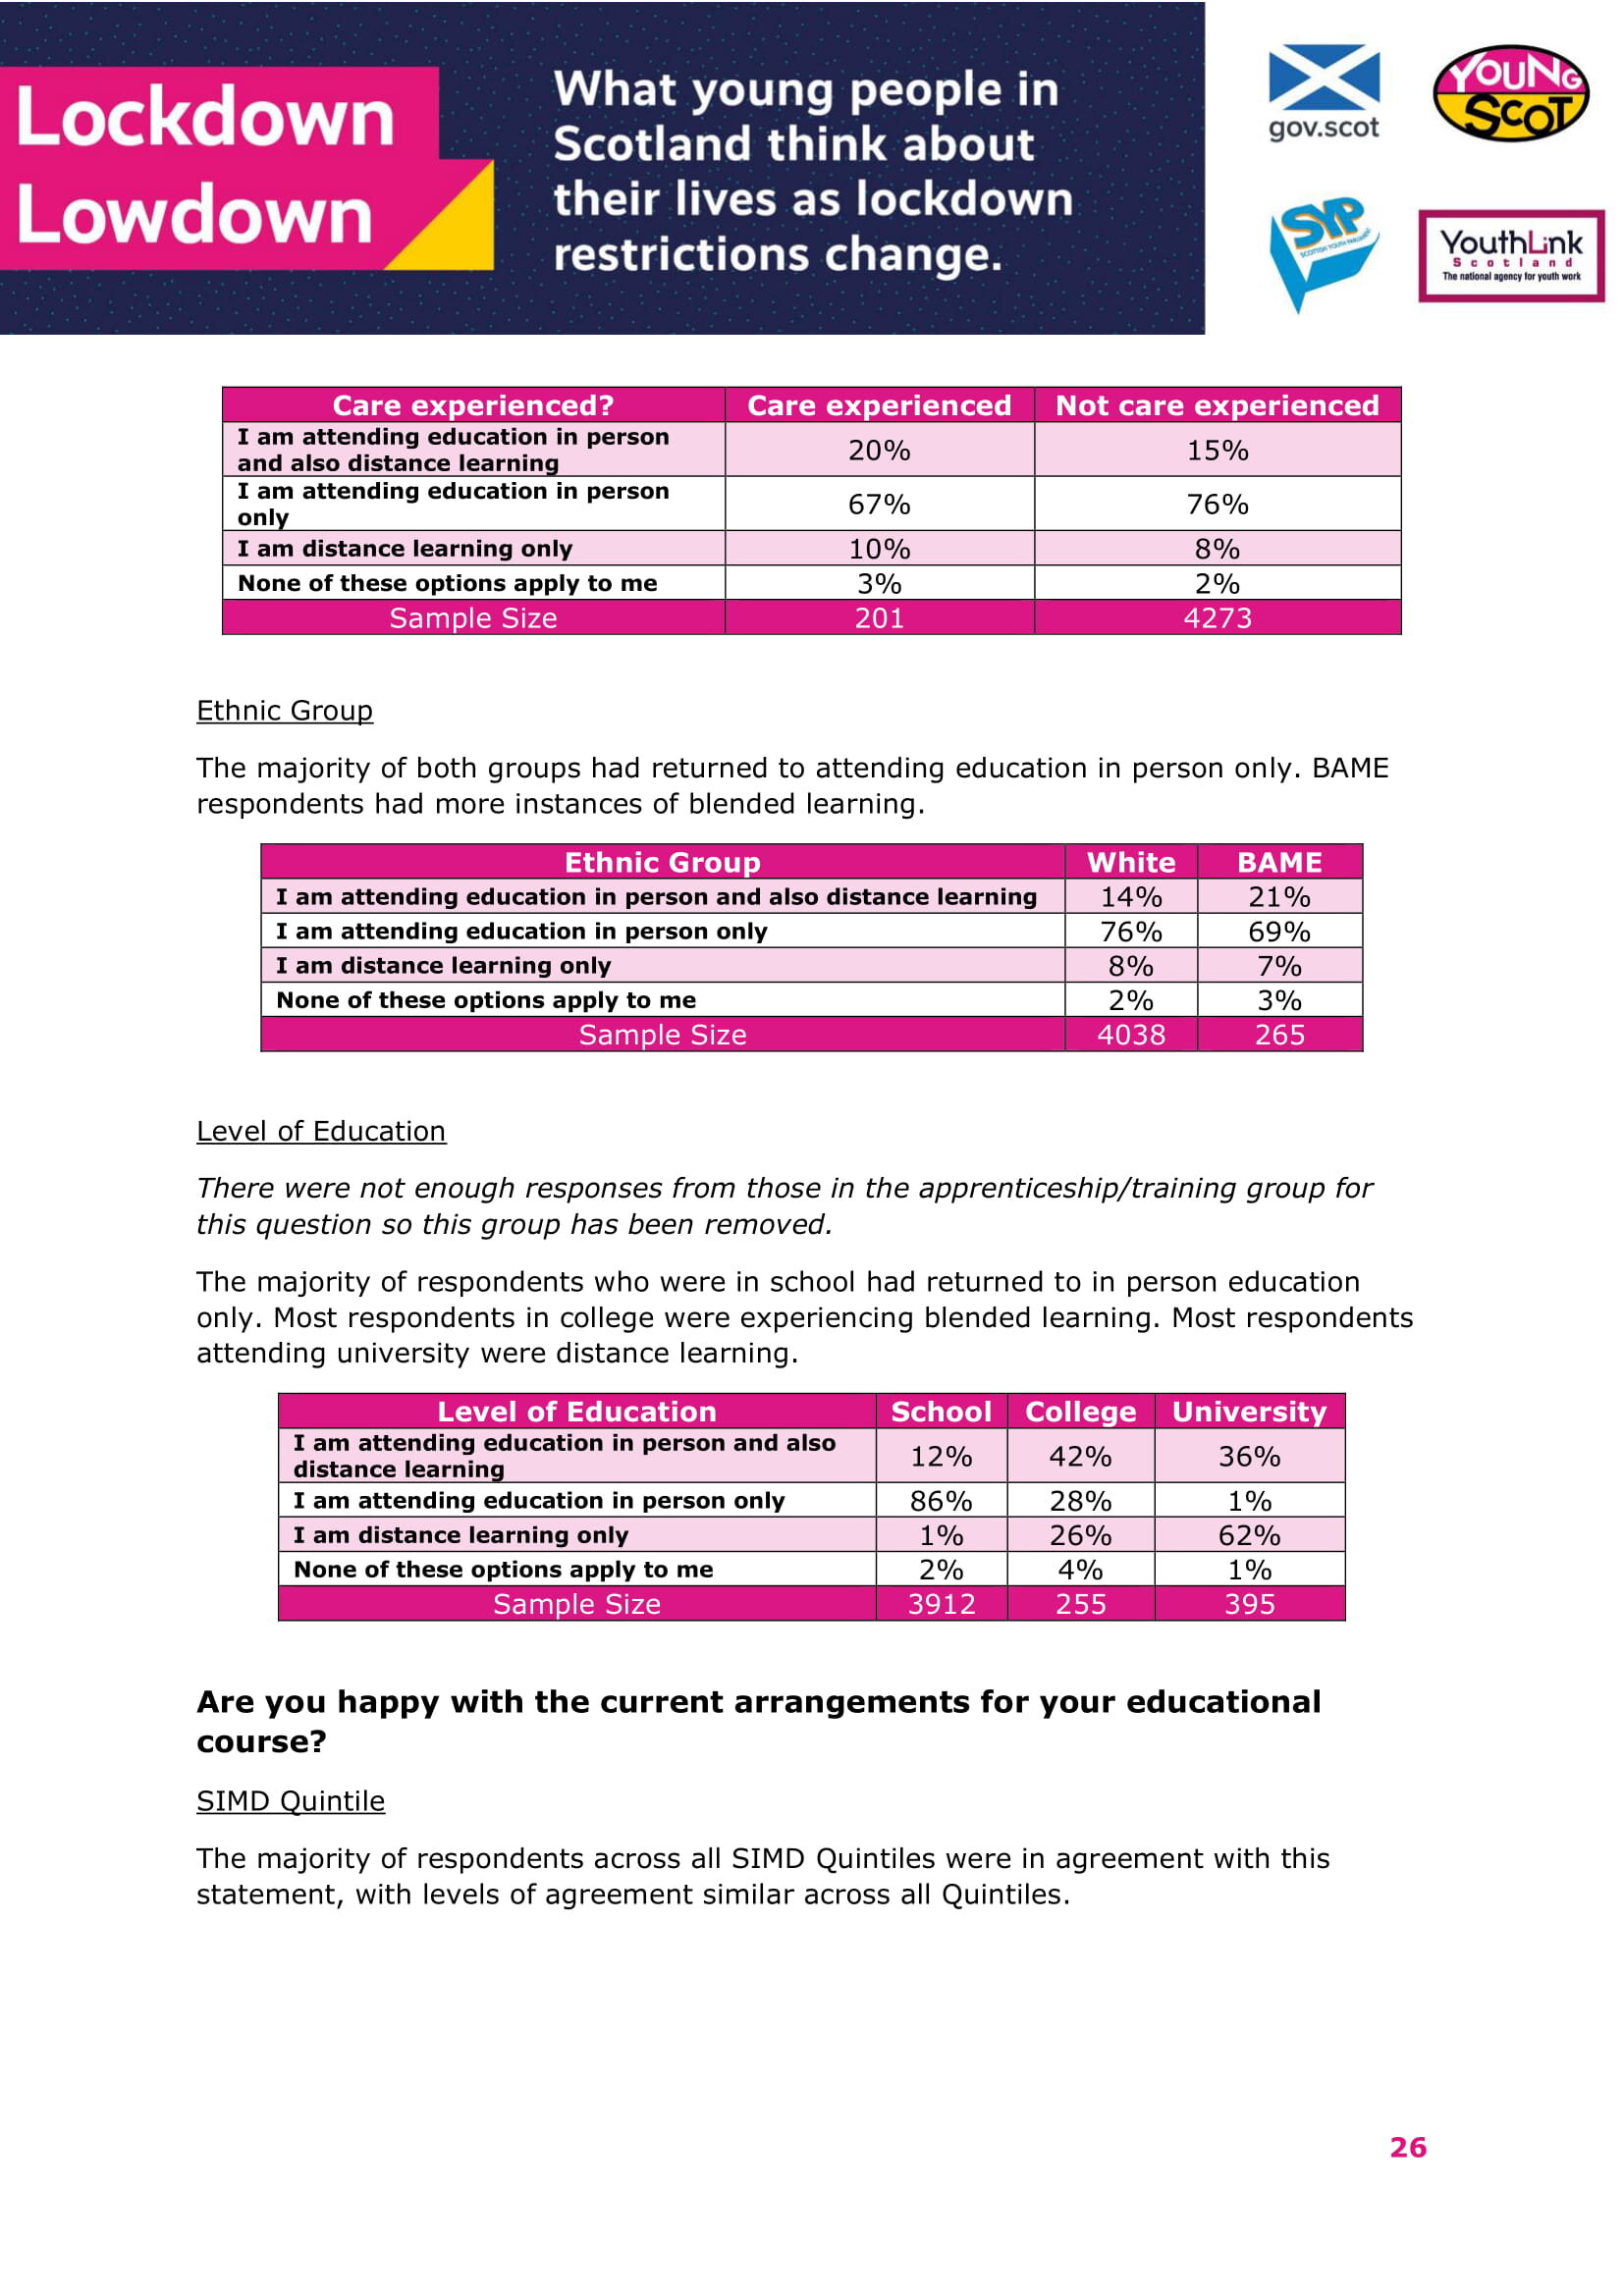
Care Experienced
Both groups had mainly returned to attending education in person only. Care experienced respondents had more instances of blended learning.
Care experienced? Care experienced Not care experienced
I am attending education in person and also distance learning 20% 15%
I am attending education in person only 67% 76%
I am distance learning only 10% 8%
None of these options apply to me 3% 2%
Sample Size 201 4273
Ethnic Group
The majority of both groups had returned to attending education in person only. BAME respondents had more instances of blended learning.
Ethnic Group White BAME
I am attending education in person and also distance learning 14% 21%
I am attending education in person only 76% 69%
I am distance learning only 8% 7%
None of these options apply to me 2% 3%
Sample Size 4038 265
Level of Education
There were not enough responses from those in the apprenticeship/training group for this question so this group has been removed.
The majority of respondents who were in school had returned to in person education only. Most respondents in college were experiencing blended learning. Most respondents attending university were distance learning.
Level of Education School College University
I am attending education in person and also distance learning 12% 42% 36%
I am attending education in person only 86% 28% 1%
I am distance learning only 1% 26% 62%
None of these options apply to me 2% 4% 1%
Sample Size 3912 255 395
Are you happy with the current arrangements for your educational course?
SIMD Quintile
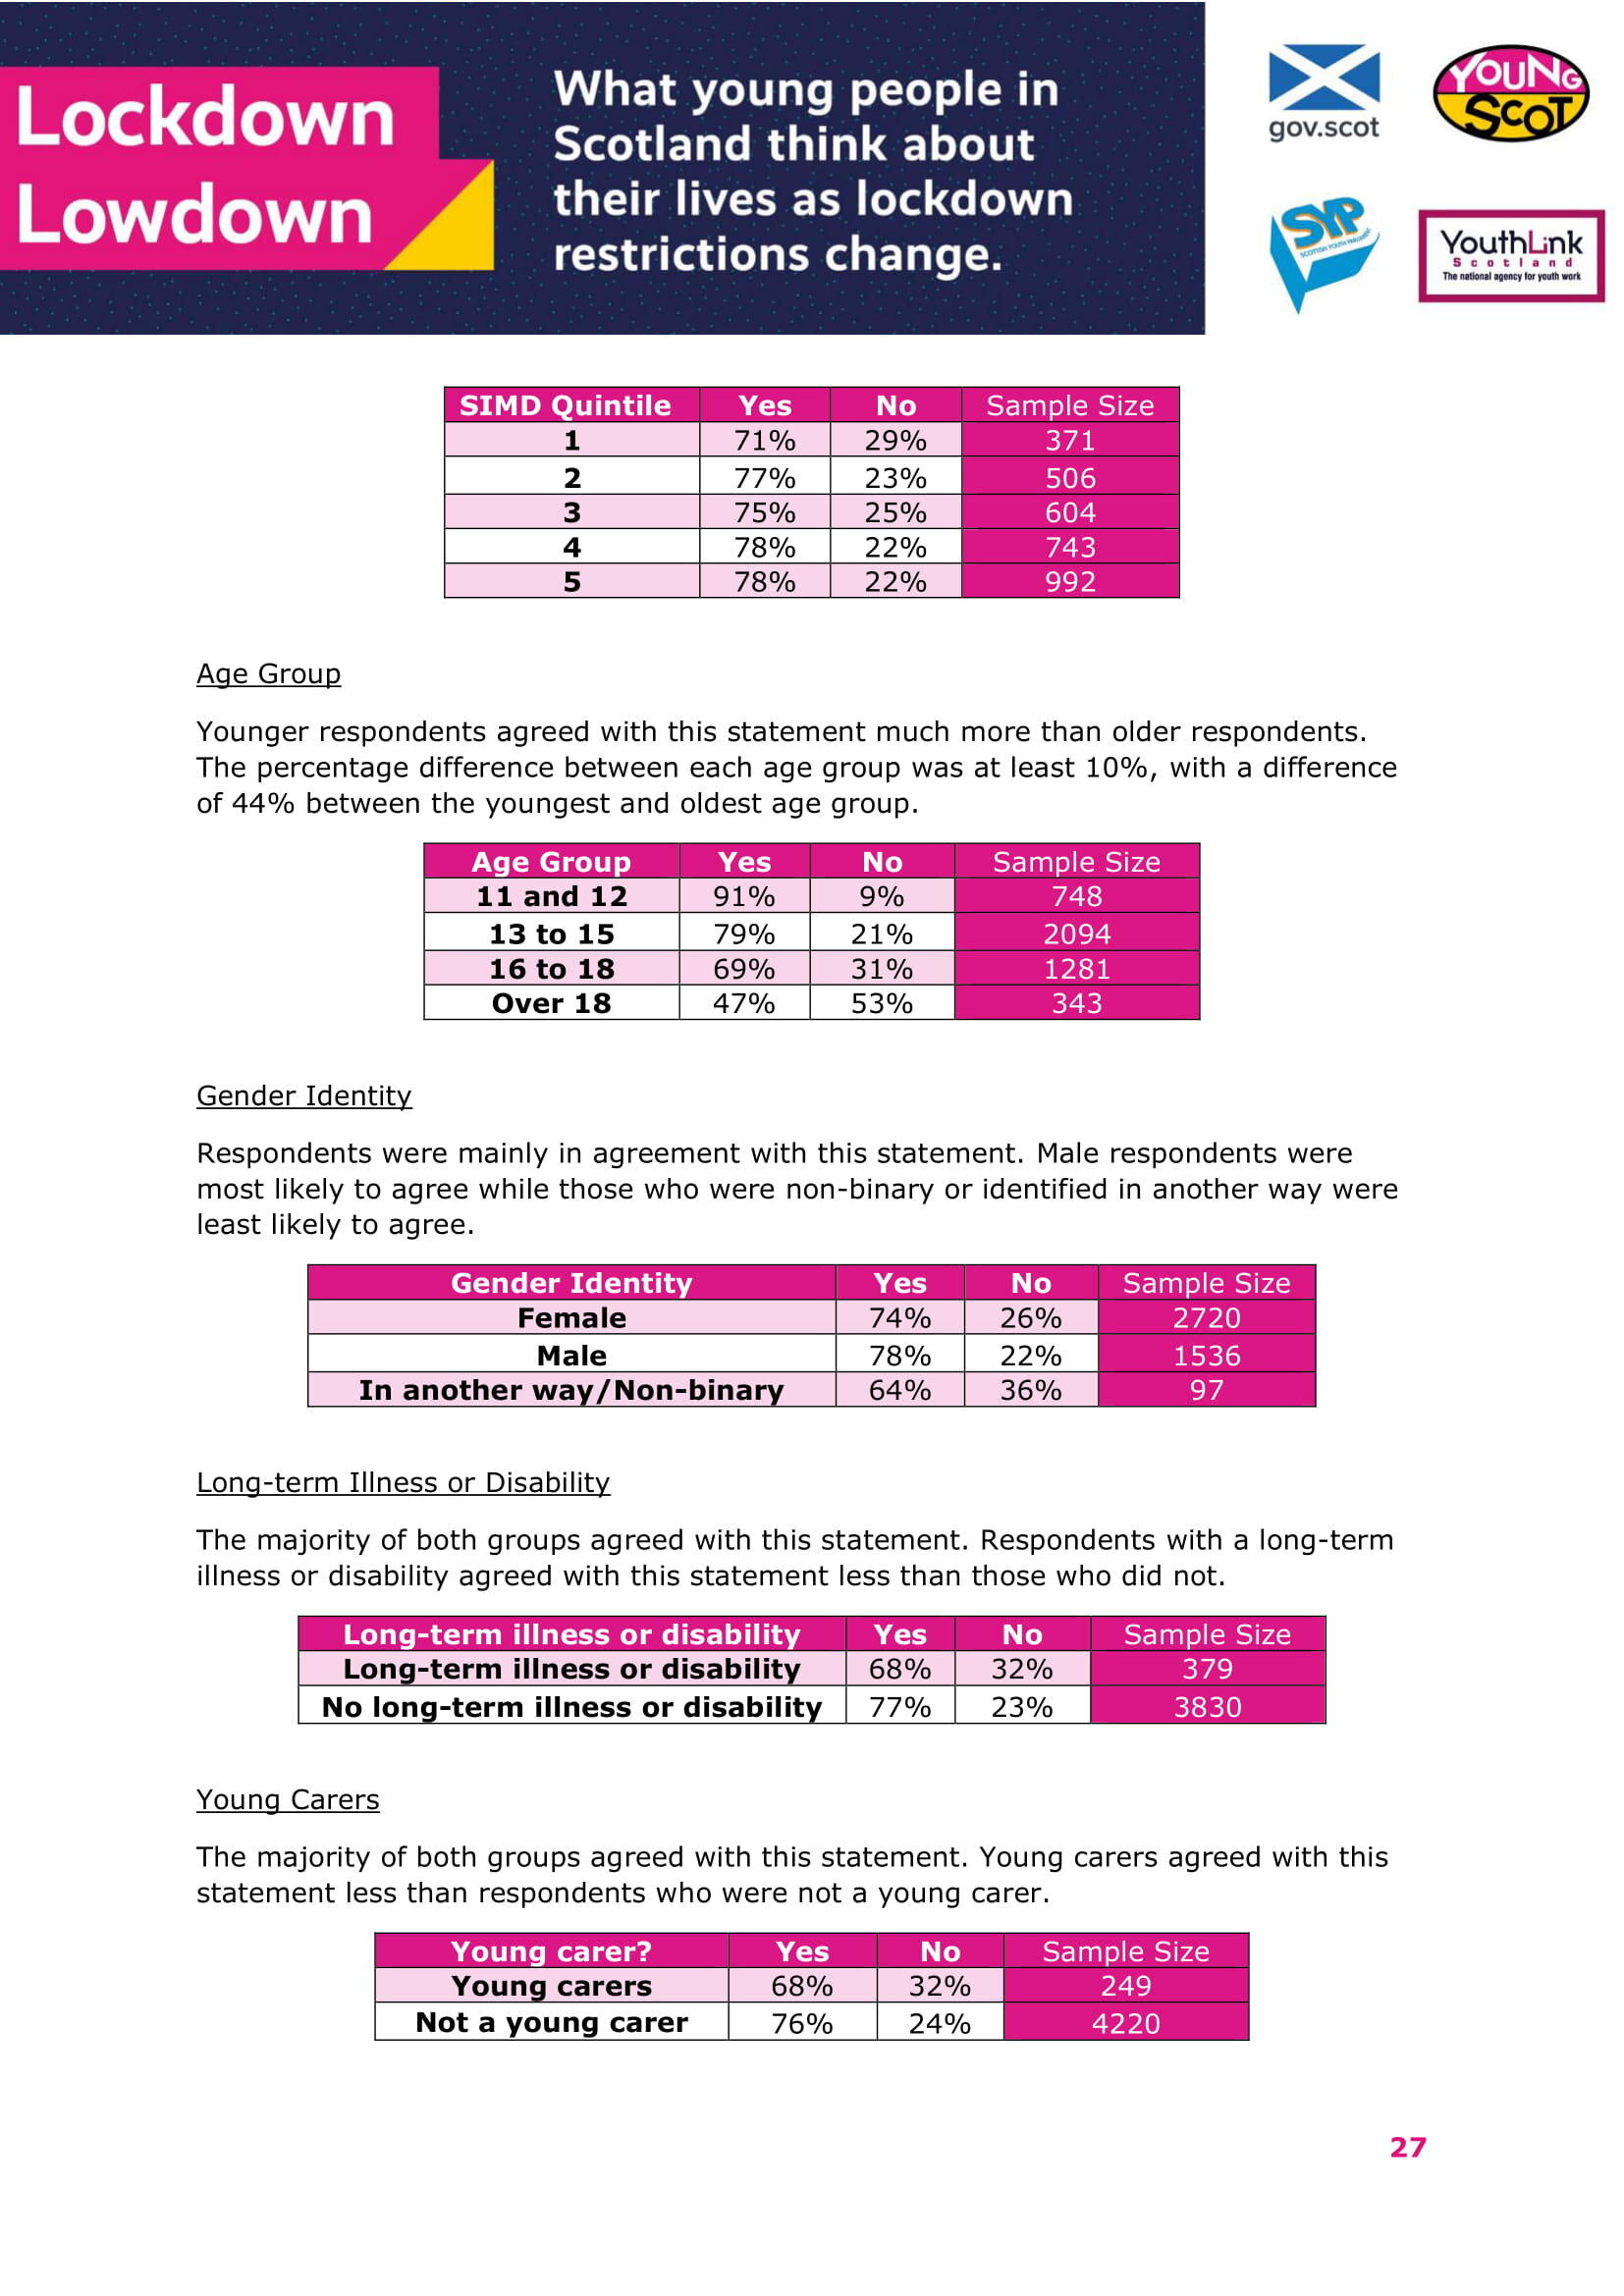
The majority of respondents across all SIMD Quintiles were in agreement with this statement, with levels of agreement similar across all Quintiles.
SIMD Quintile Yes No Sample Size
1 71% 29% 371
2 77% 23% 506
3 75% 25% 604
4 78% 22% 743
5 78% 22% 992
Age Group
Younger respondents agreed with this statement much more than older respondents. The percentage difference between each age group was at least 10%, with a difference of 44% between the youngest and oldest age group.
Age Group Yes No Sample Size
11 and 12 91% 9% 748
13 to 15 79% 21% 2094
16 to 18 69% 31% 1281
Over 18 47% 53% 343
Gender Identity
Respondents were mainly in agreement with this statement. Male respondents were most likely to agree while those who were non-binary or identified in another way were least likely to agree.
Gender Identity Yes No Sample Size
Female 74% 26% 2720
Male 78% 22% 1536
In another way/Non-binary 64% 36% 97
Long-term Illness or Disability
The majority of both groups agreed with this statement. Respondents with a long-term illness or disability agreed with this statement less than those who did not.
Long-term illness or disability Yes No Sample Size
Long-term illness or disability 68% 32% 379
No long-term illness or disability 77% 23% 3830
Young Carers
The majority of both groups agreed with this statement. Young carers agreed with this statement less than respondents who were not a young carer.
Young carer? Yes No Sample Size
Young carers 68% 32% 249
Not a young carer 76% 24% 4220
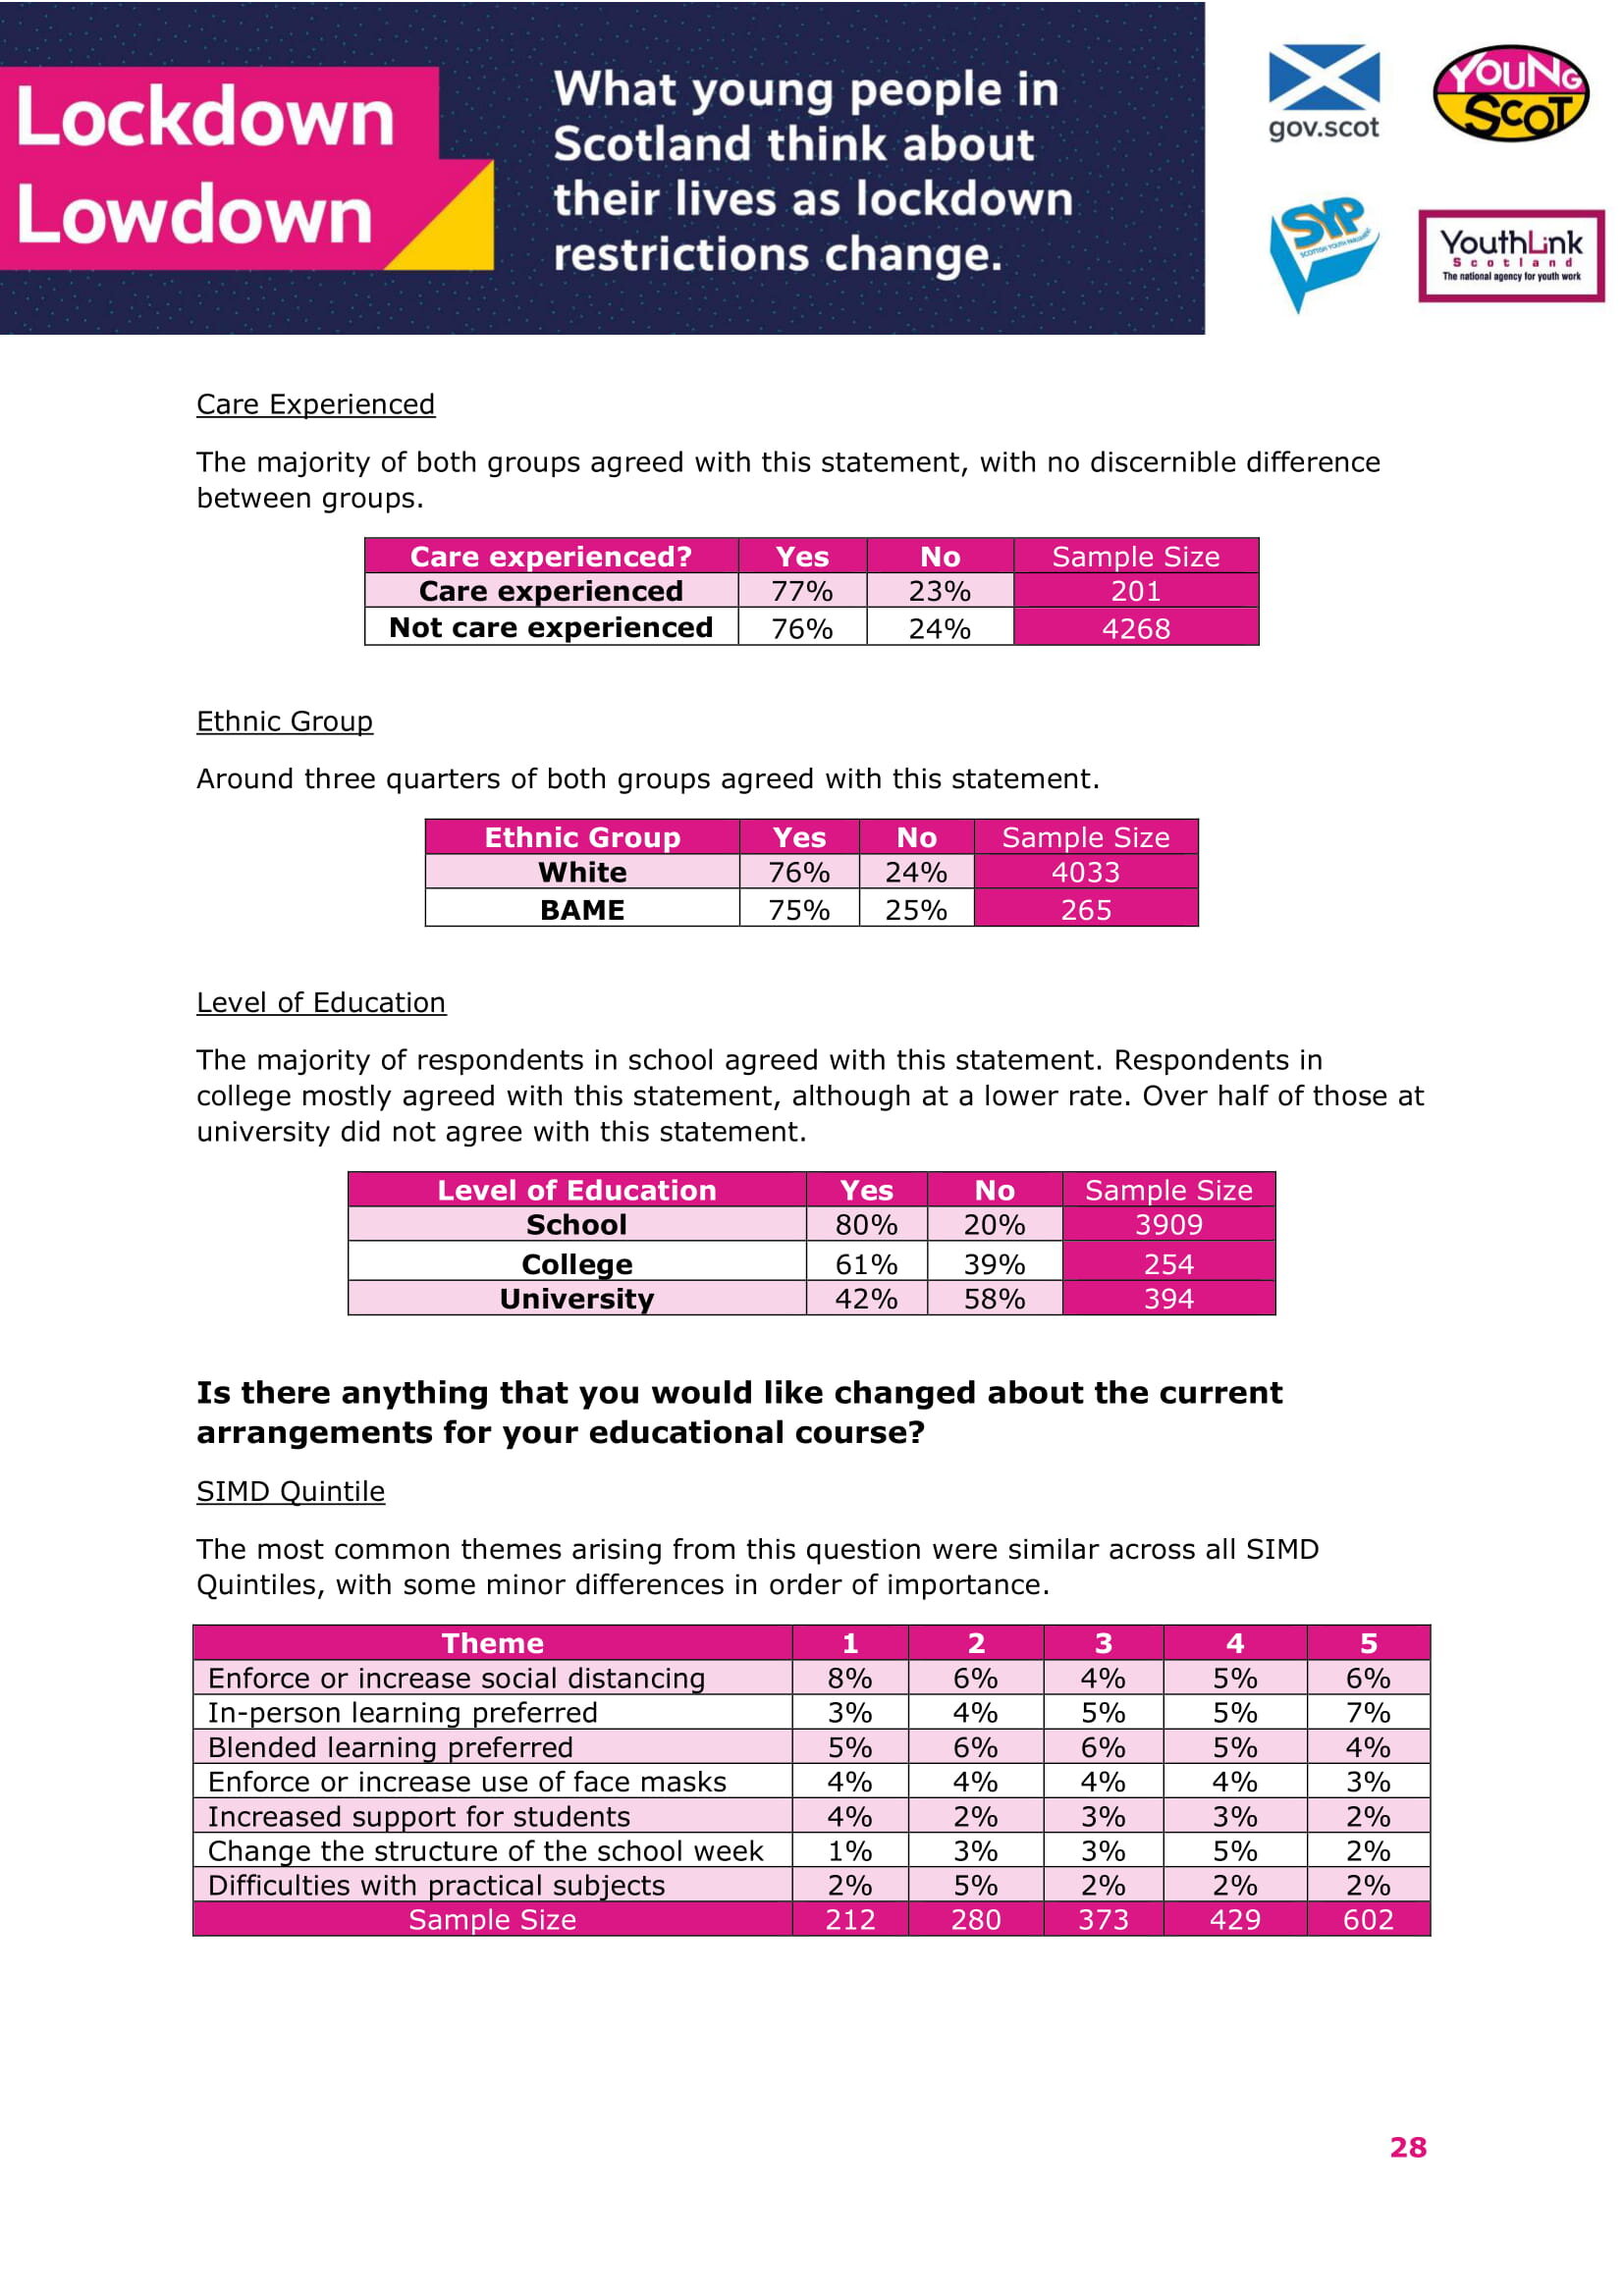
Care Experienced
The majority of both groups agreed with this statement, with no discernible difference between groups.
Care experienced? Yes No Sample Size
Care experienced 77% 23% 201
Not care experienced 76% 24% 4268
Ethnic Group
Around three quarters of both groups agreed with this statement.
Ethnic Group Yes No Sample Size
White 76% 24% 4033
BAME 75% 25% 265
Level of Education
The majority of respondents in school agreed with this statement. Respondents in college mostly agreed with this statement, although at a lower rate. Over half of those at university did not agree with this statement.
Level of Education Yes No Sample Size
School 80% 20% 3909
College 61% 39% 254
University 42% 58% 394
Is there anything that you would like changed about the current arrangements for your educational course?
SIMD Quintile
The most common themes arising from this question were similar across all SIMD Quintiles, with some minor differences in order of importance.
Theme 1 2 3 4 5
Enforce or increase social distancing 8% 6% 4% 5% 6%
In-person learning preferred 3% 4% 5% 5% 7%
Blended learning preferred 5% 6% 6% 5% 4%
Enforce or increase use of face masks 4% 4% 4% 4% 3%
Increased support for students 4% 2% 3% 3% 2%
Change the structure of the school week 1% 3% 3% 5% 2%
Difficulties with practical subjects 2% 5% 2% 2% 2%
Sample Size 212 280 373 429 602
Age Group
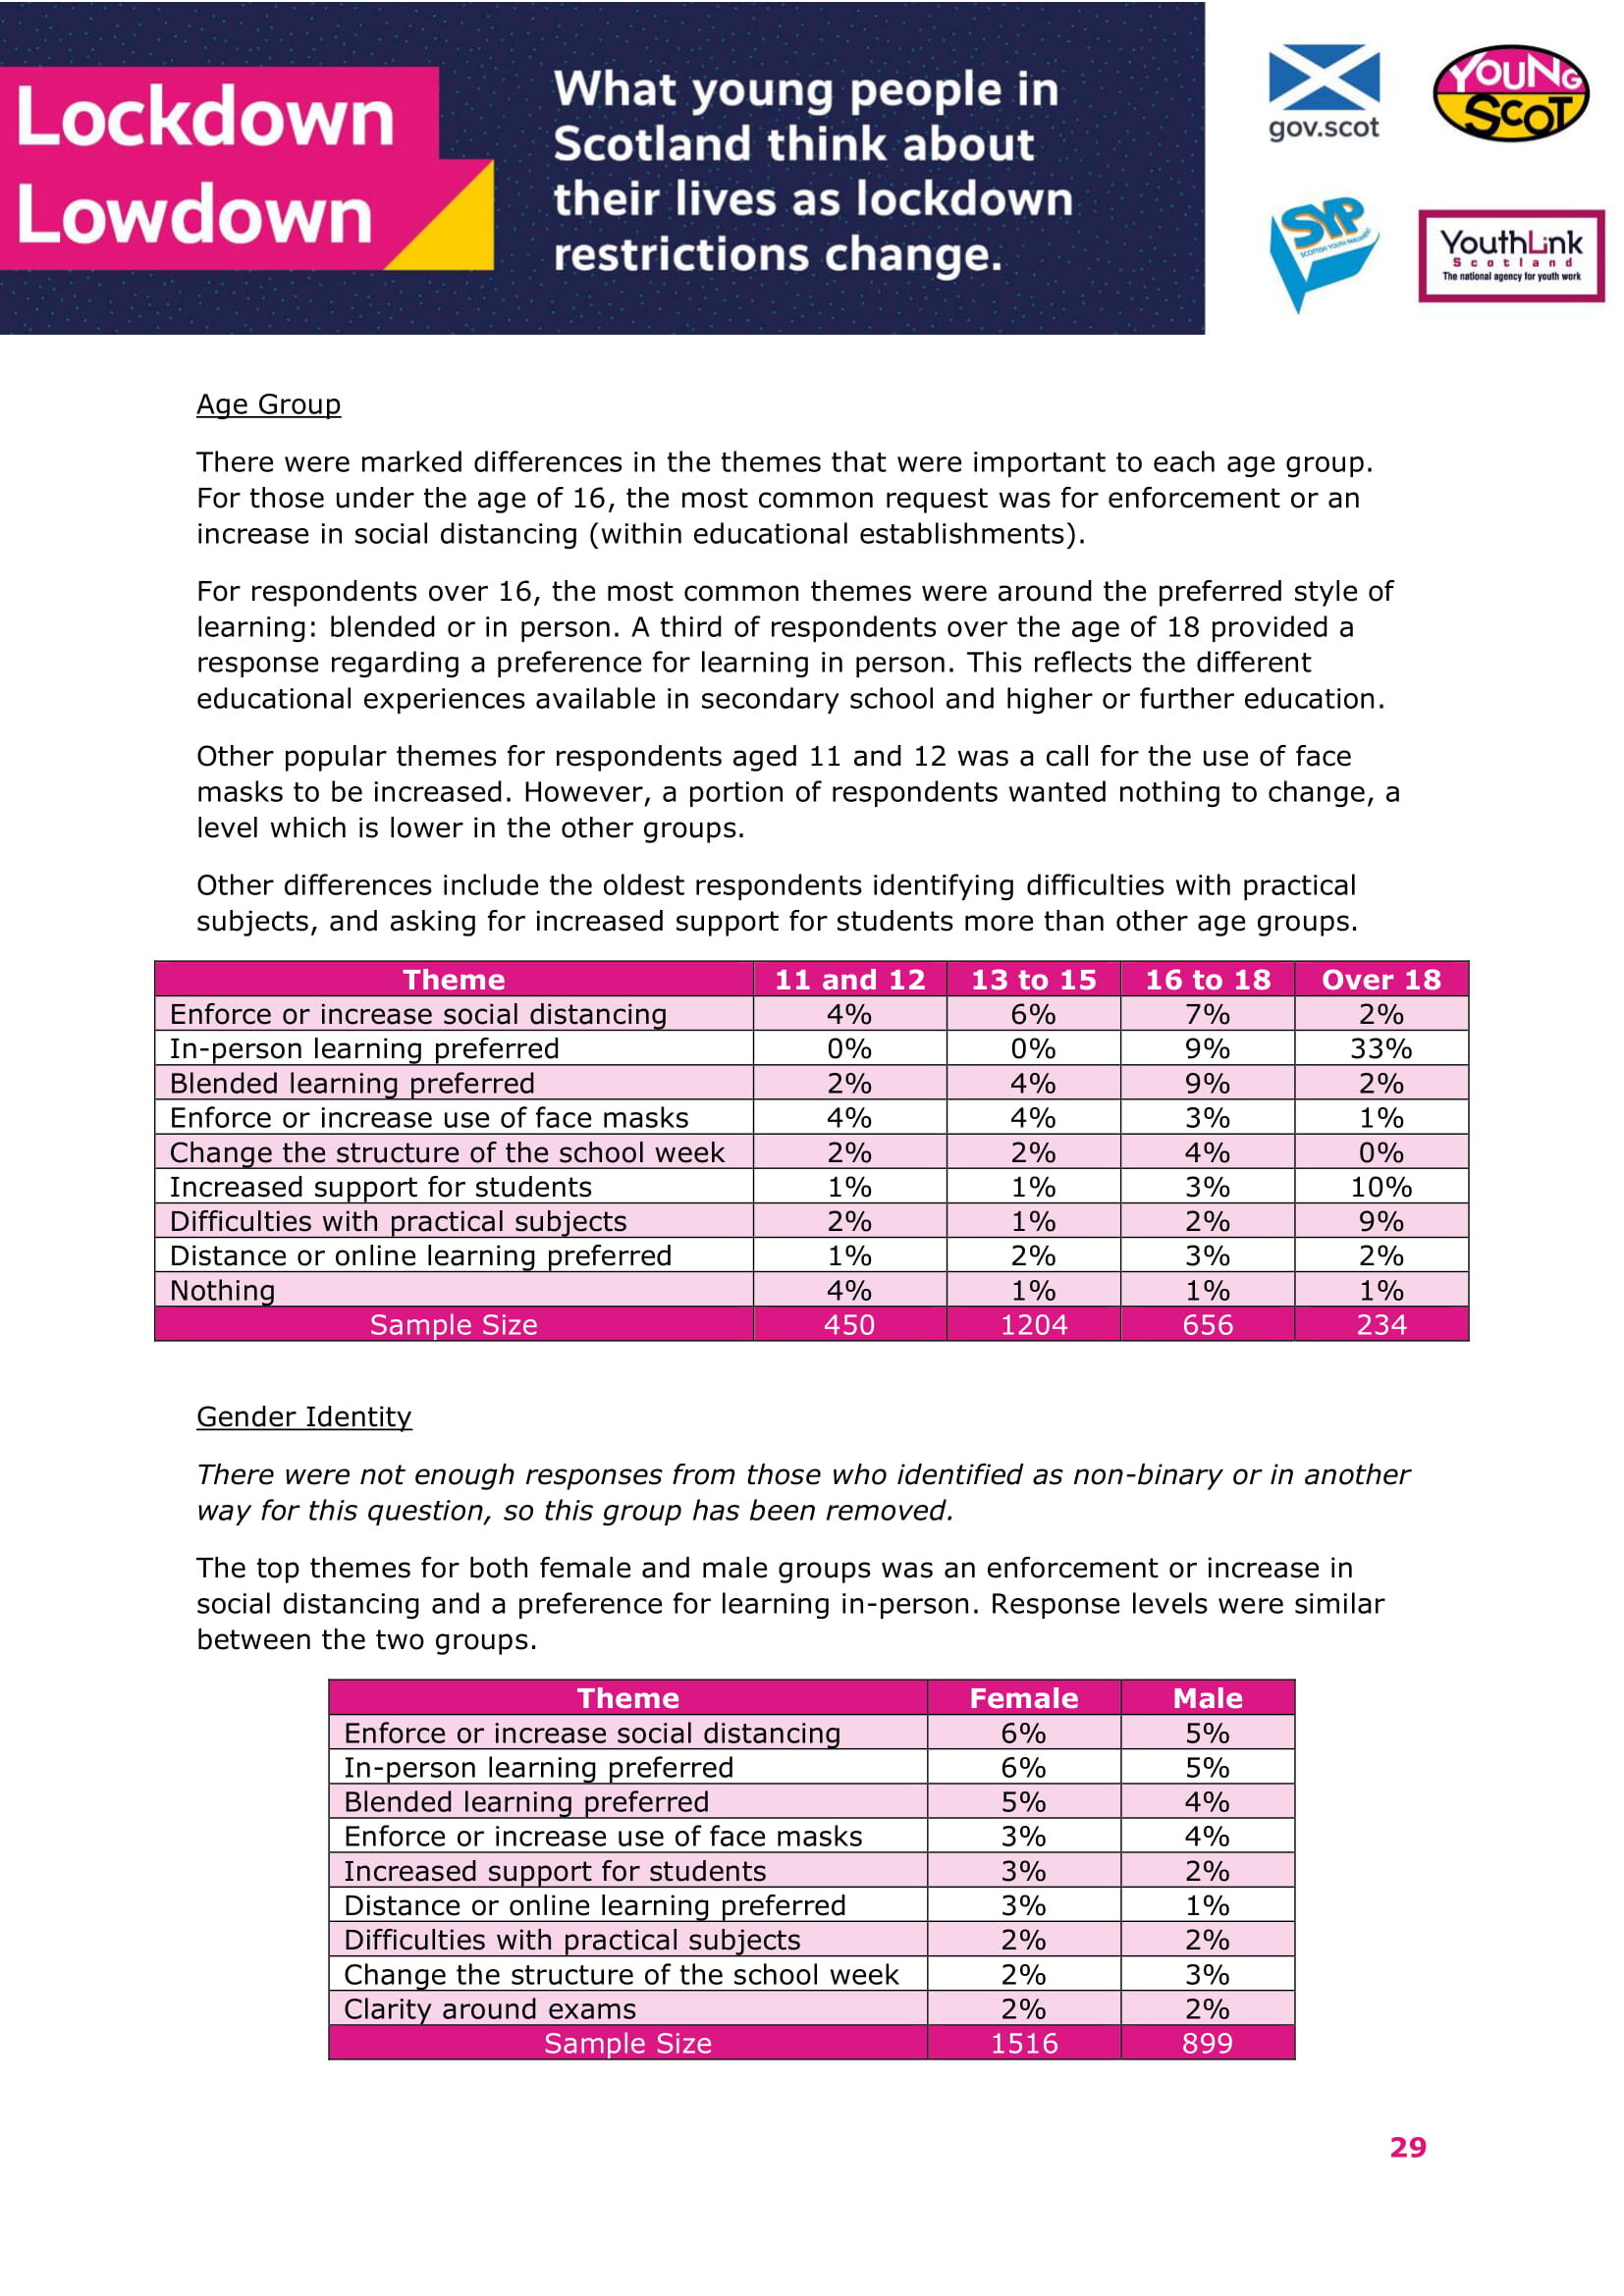
There were marked differences in the themes that were important to each age group. For those under the age of 16, the most common request was for enforcement or an increase in social distancing (within educational establishments).
For respondents over 16, the most common themes were around the preferred style of learning: blended or in person. A third of respondents over the age of 18 provided a response regarding a preference for learning in person. This reflects the different educational experiences available in secondary school and higher or further education.
Other popular themes for respondents aged 11 and 12 was a call for the use of face masks to be increased. However, a portion of respondents wanted nothing to change, a level which is lower in the other groups.
Other differences include the oldest respondents identifying difficulties with practical subjects, and asking for increased support for students more than other age groups.
Theme 11 and 12 13 to 15 16 to 18 Over 18
Enforce or increase social distancing 4% 6% 7% 2%
In-person learning preferred 0% 0% 9% 33%
Blended learning preferred 2% 4% 9% 2%
Enforce or increase use of face masks 4% 4% 3% 1%
Change the structure of the school week 2% 2% 4% 0%
Increased support for students 1% 1% 3% 10%
Difficulties with practical subjects 2% 1% 2% 9%
Distance or online learning preferred 1% 2% 3% 2%
Nothing 4% 1% 1% 1%
Sample Size 450 1204 656 234
Gender Identity
There were not enough responses from those who identified as non-binary or in another way for this question, so this group has been removed.
The top themes for both female and male groups was an enforcement or increase in social distancing and a preference for learning in-person. Response levels were similar between the two groups.
Theme Female Male
Enforce or increase social distancing 6% 5%
In-person learning preferred 6% 5%
Blended learning preferred 5% 4%
Enforce or increase use of face masks 3% 4%
Increased support for students 3% 2%
Distance or online learning preferred 3% 1%
Difficulties with practical subjects 2% 2%
Change the structure of the school week 2% 3%
Clarity around exams 2% 2%
Sample Size 1516 899
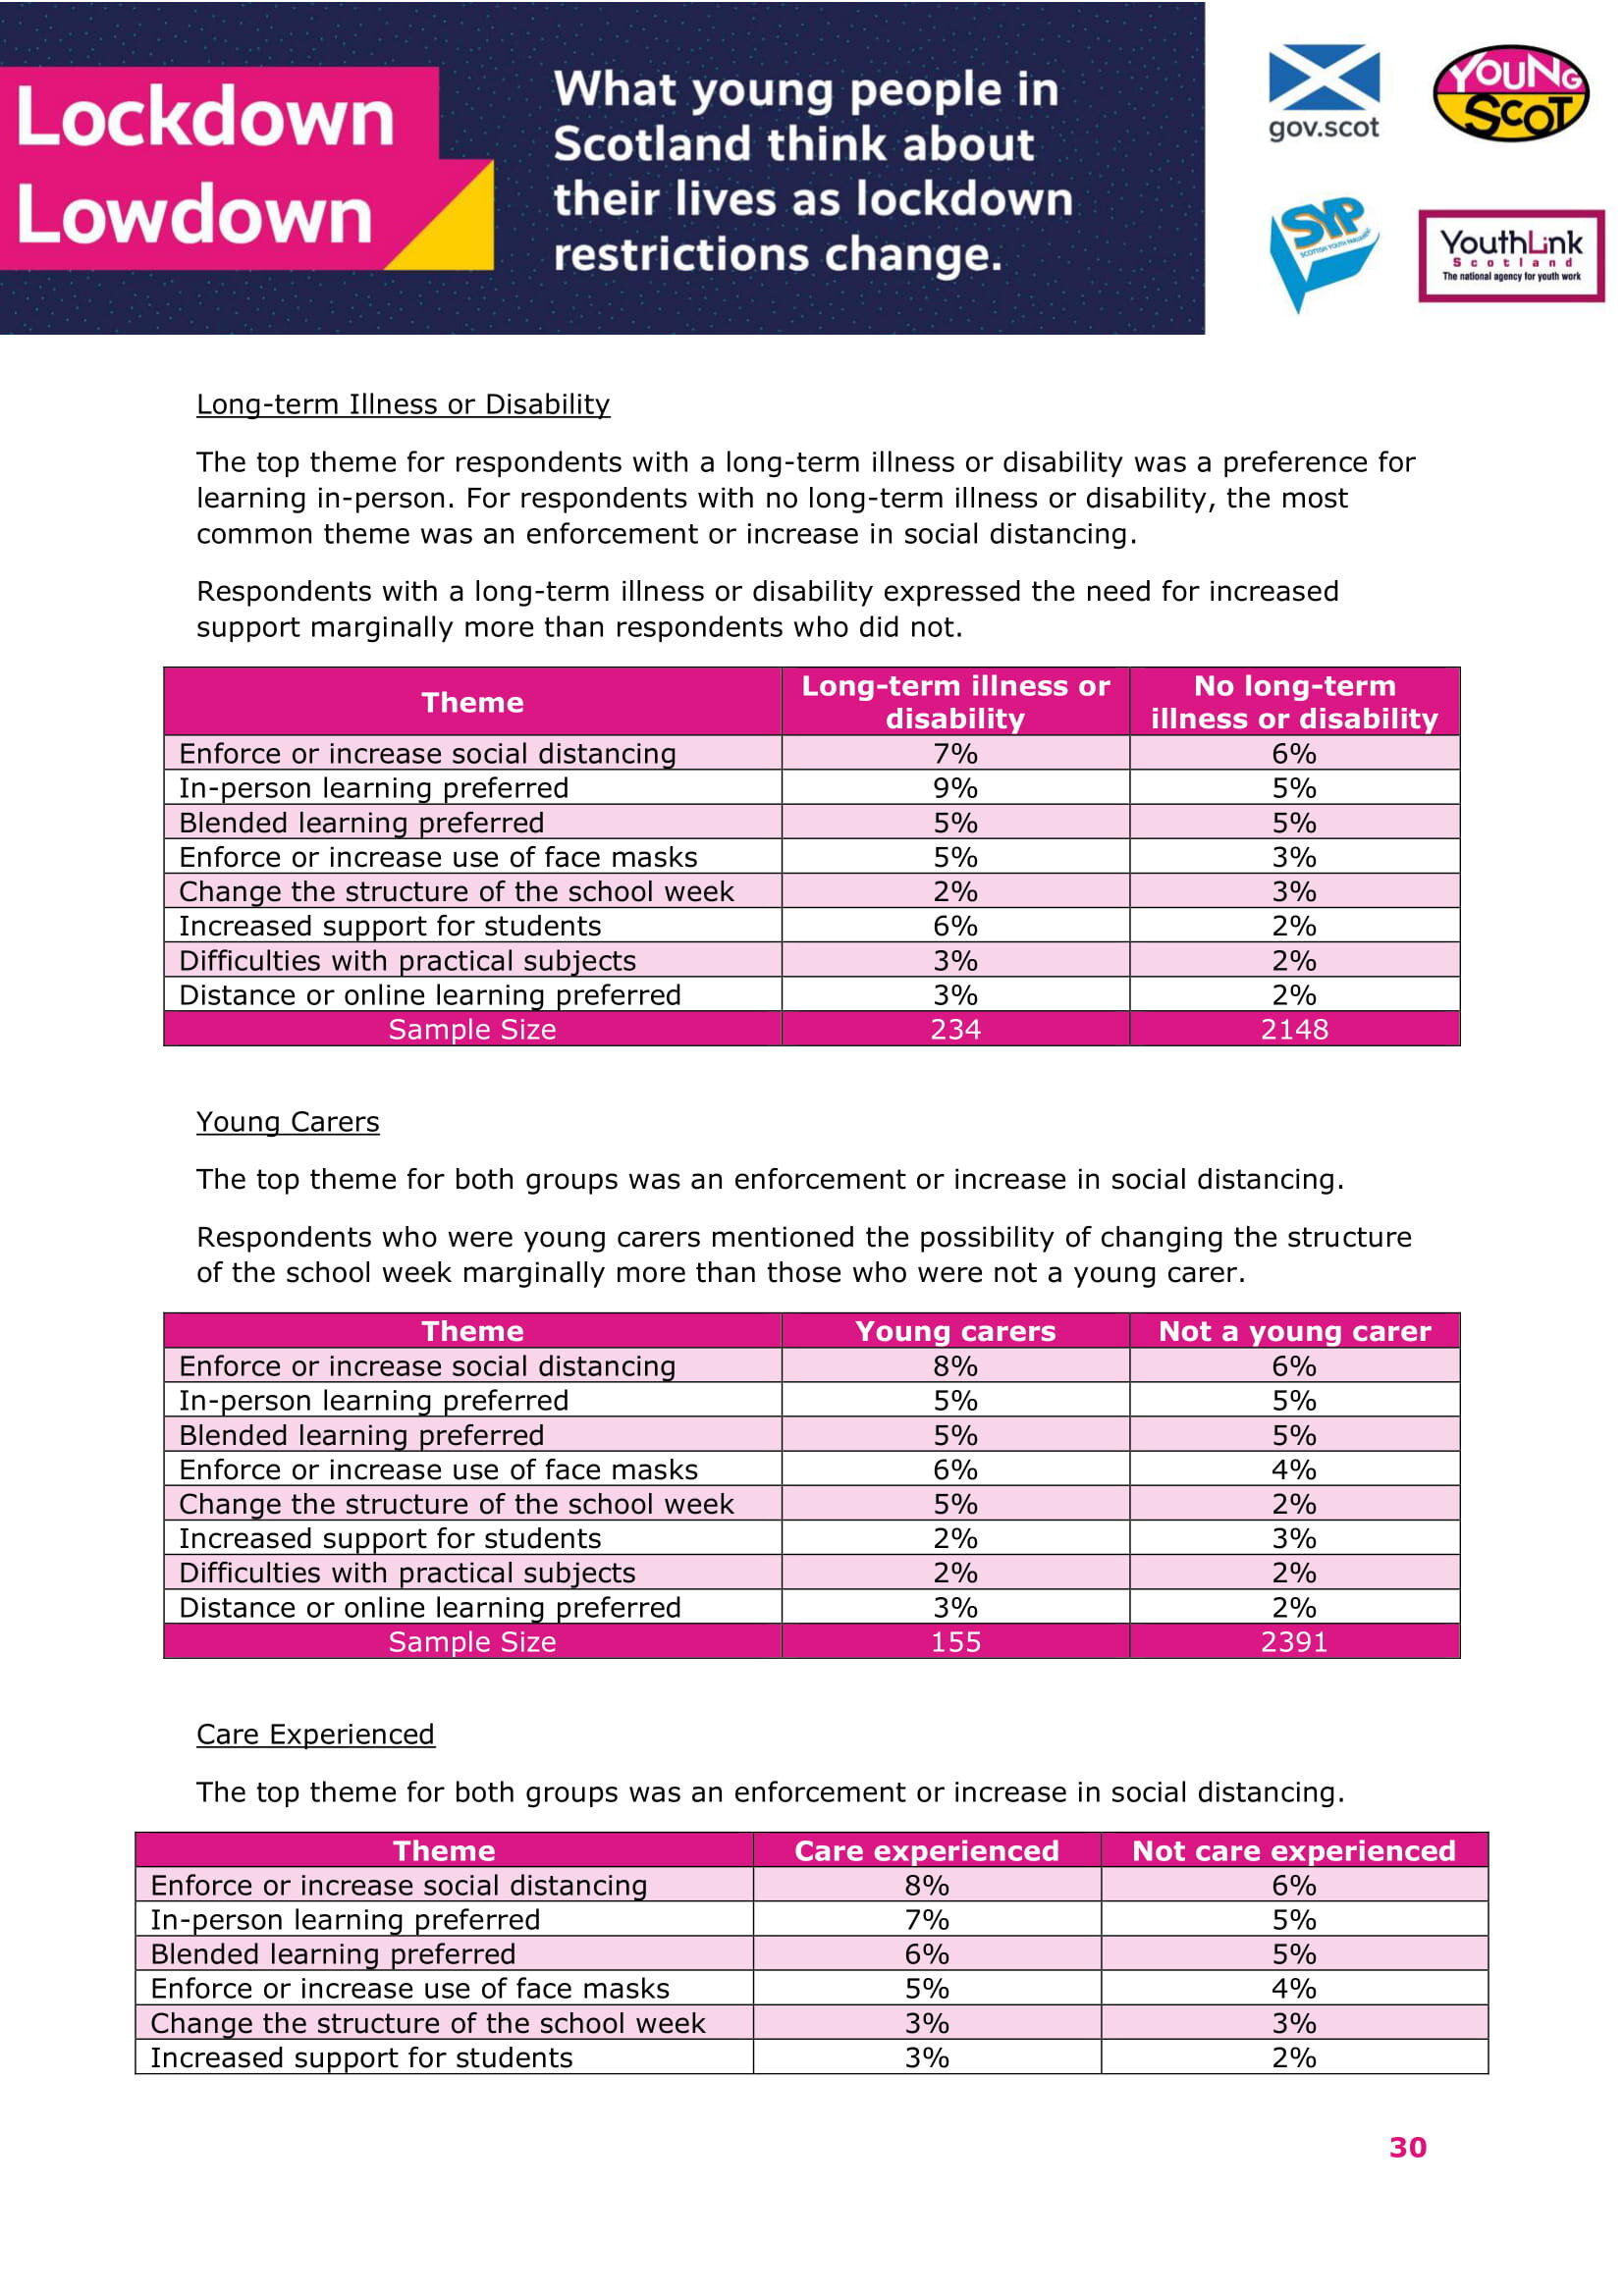
Long-term Illness or Disability
The top theme for respondents with a long-term illness or disability was a preference for learning in-person. For respondents with no long-term illness or disability, the most common theme was an enforcement or increase in social distancing.
Respondents with a long-term illness or disability expressed the need for increased support marginally more than respondents who did not.
Theme Long-term illness or disability No long-term illness or disability
Enforce or increase social distancing 7% 6%
In-person learning preferred 9% 5%
Blended learning preferred 5% 5%
Enforce or increase use of face masks 5% 3%
Change the structure of the school week 2% 3%
Increased support for students 6% 2%
Difficulties with practical subjects 3% 2%
Distance or online learning preferred 3% 2%
Sample Size 234 2148
Young Carers
The top theme for both groups was an enforcement or increase in social distancing.
Respondents who were young carers mentioned the possibility of changing the structure of the school week marginally more than those who were not a young carer.
Theme Young carers Not a young carer
Enforce or increase social distancing 8% 6%
In-person learning preferred 5% 5%
Blended learning preferred 5% 5%
Enforce or increase use of face masks 6% 4%
Change the structure of the school week 5% 2%
Increased support for students 2% 3%
Difficulties with practical subjects 2% 2%
Distance or online learning preferred 3% 2%
Sample Size 155 2391
Care Experienced
The top theme for both groups was an enforcement or increase in social distancing.
Theme Care experienced Not care experienced
Enforce or increase social distancing 8% 6%
In-person learning preferred 7% 5%
Blended learning preferred 6% 5%
Enforce or increase use of face masks 5% 4%
Change the structure of the school week 3% 3%
Increased support for students 3% 2%
Difficulties with practical subjects 2% 2%
Distance or online learning preferred 4% 2%
Sample Size 126 2420
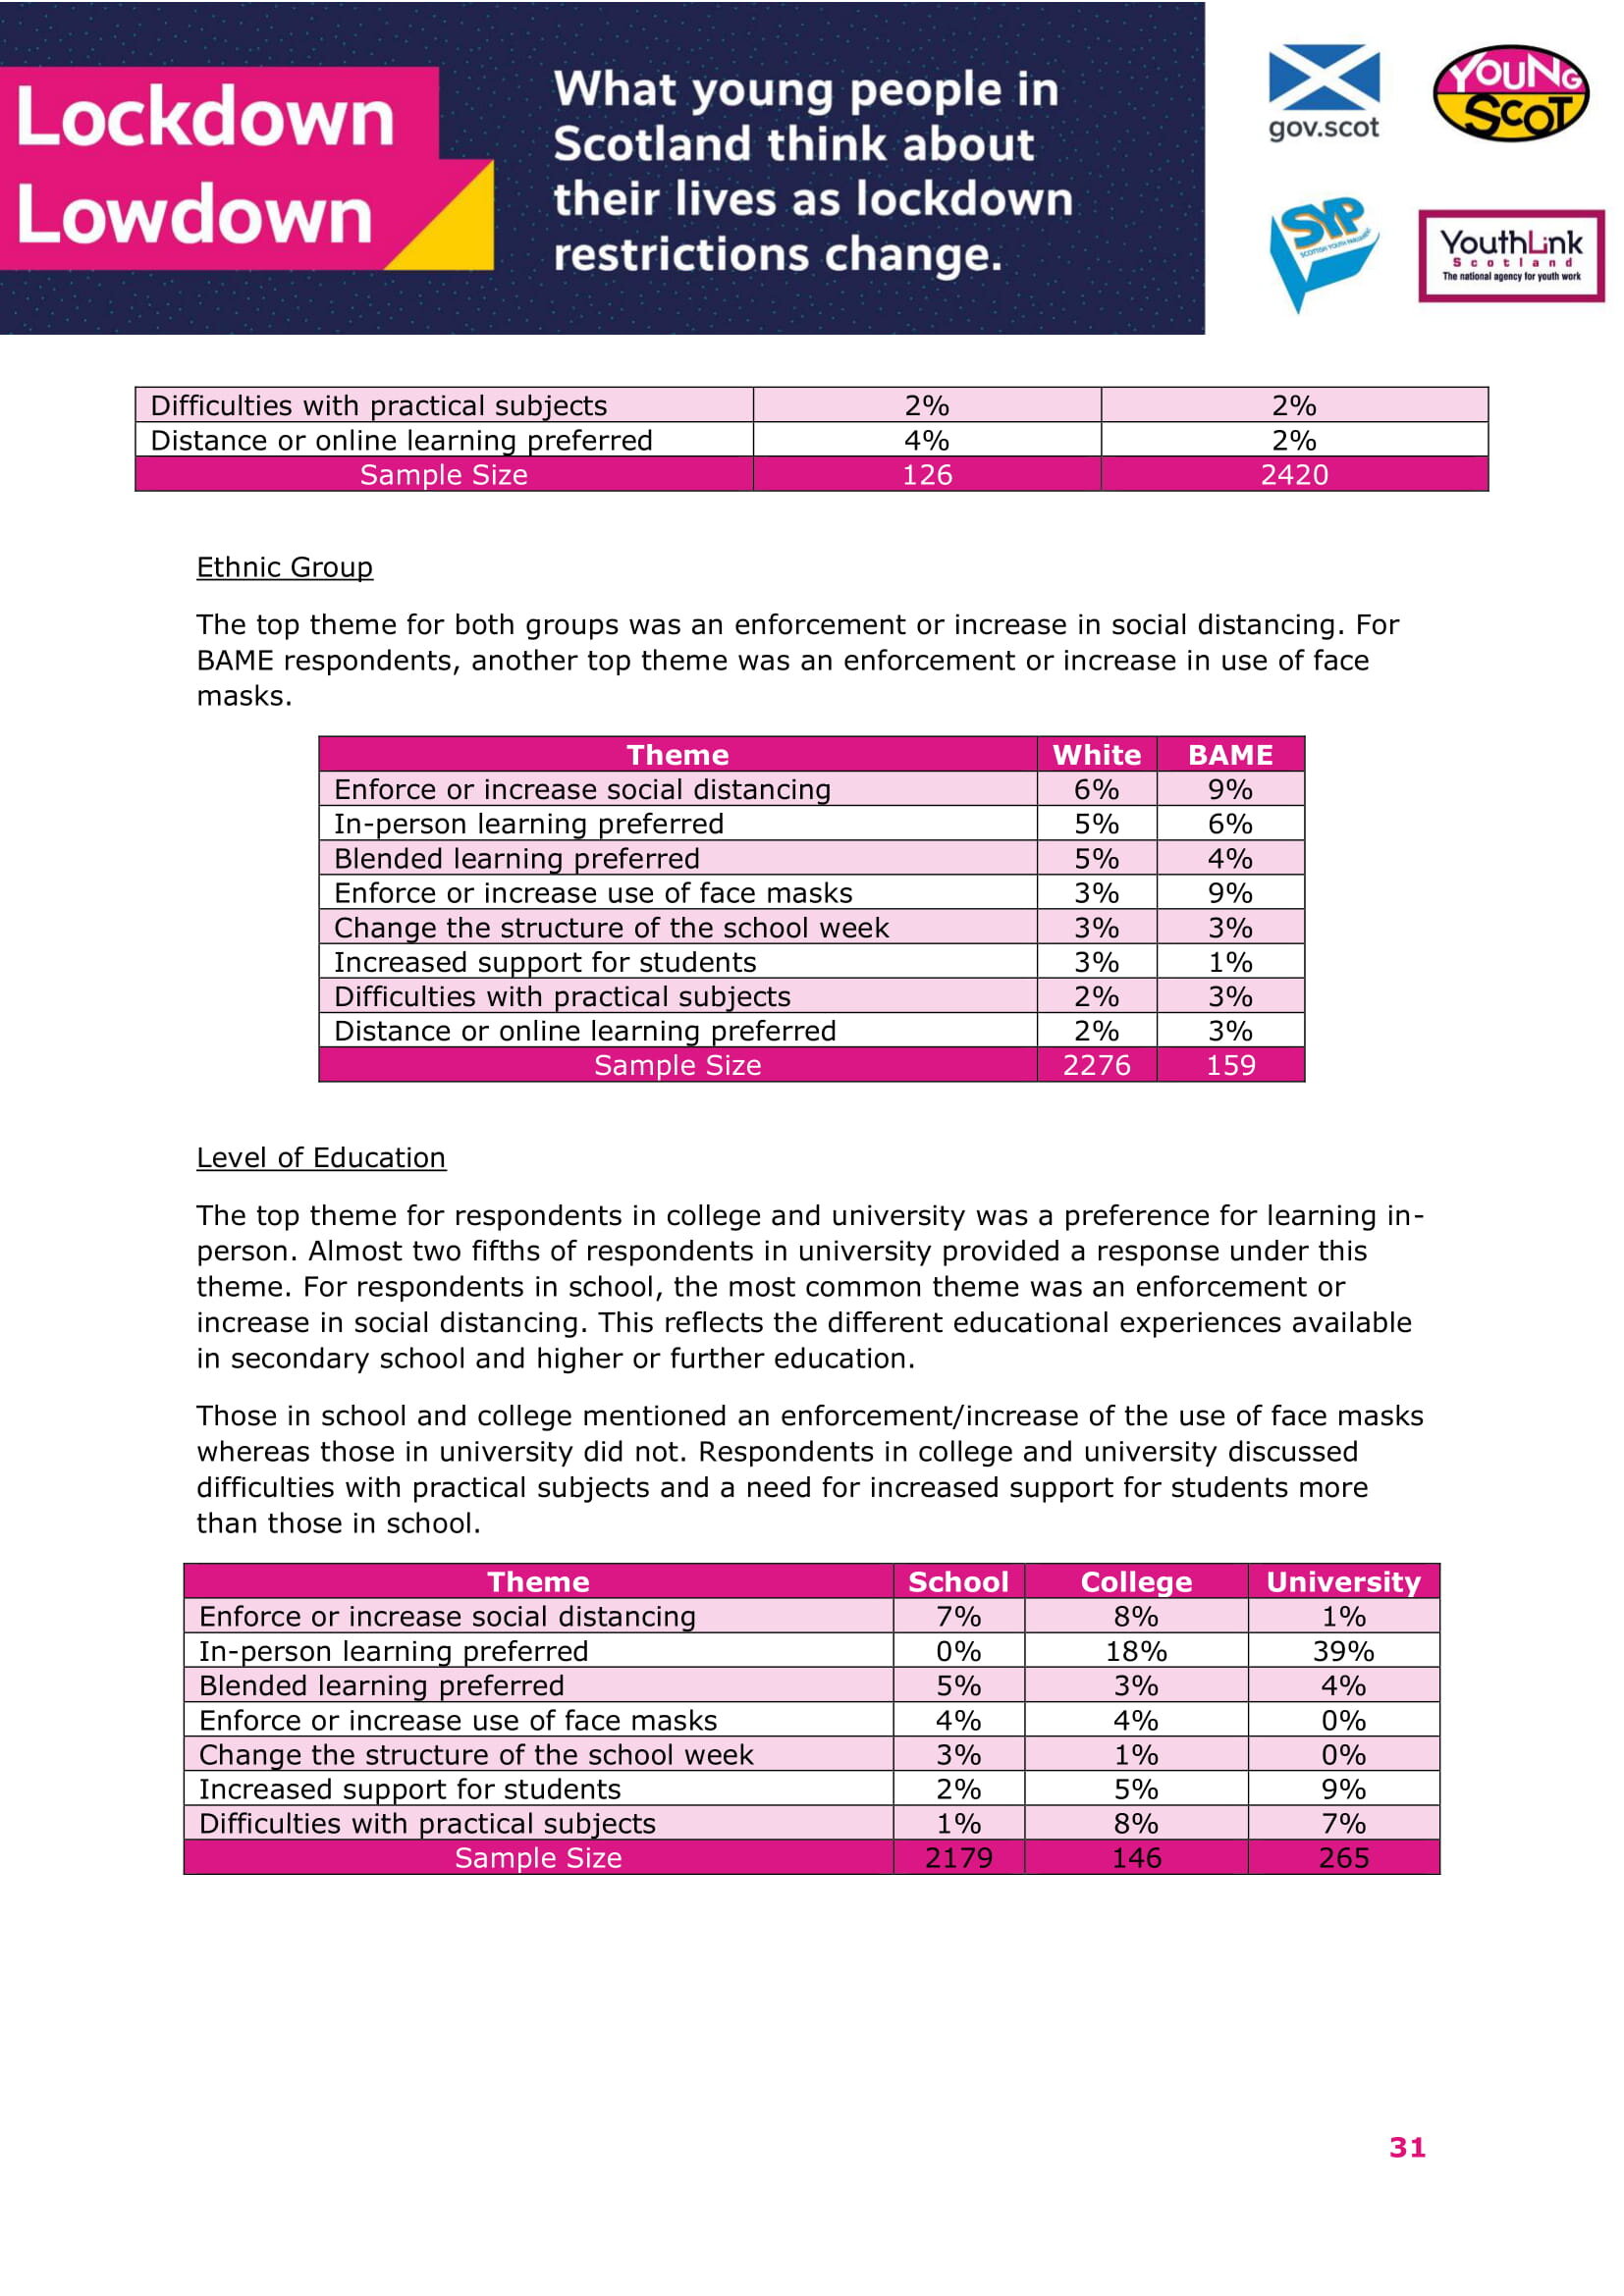
Ethnic Group
The top theme for both groups was an enforcement or increase in social distancing. For BAME respondents, another top theme was an enforcement or increase in use of face masks.
Theme White BAME
Enforce or increase social distancing 6% 9%
In-person learning preferred 5% 6%
Blended learning preferred 5% 4%
Enforce or increase use of face masks 3% 9%
Change the structure of the school week 3% 3%
Increased support for students 3% 1%
Difficulties with practical subjects 2% 3%
Distance or online learning preferred 2% 3%
Sample Size 2276 159
Level of Education
The top theme for respondents in college and university was a preference for learning in-person. Almost two fifths of respondents in university provided a response under this theme. For respondents in school, the most common theme was an enforcement or increase in social distancing. This reflects the different educational experiences available in secondary school and higher or further education.
Those in school and college mentioned an enforcement/increase of the use of face masks whereas those in university did not. Respondents in college and university discussed difficulties with practical subjects and a need for increased support for students more than those in school.
Theme School College University
Enforce or increase social distancing 7% 8% 1%
In-person learning preferred 0% 18% 39%
Blended learning preferred 5% 3% 4%
Enforce or increase use of face masks 4% 4% 0%
Change the structure of the school week 3% 1% 0%
Increased support for students 2% 5% 9%
Difficulties with practical subjects 1% 8% 7%
Sample Size 2179 146 265
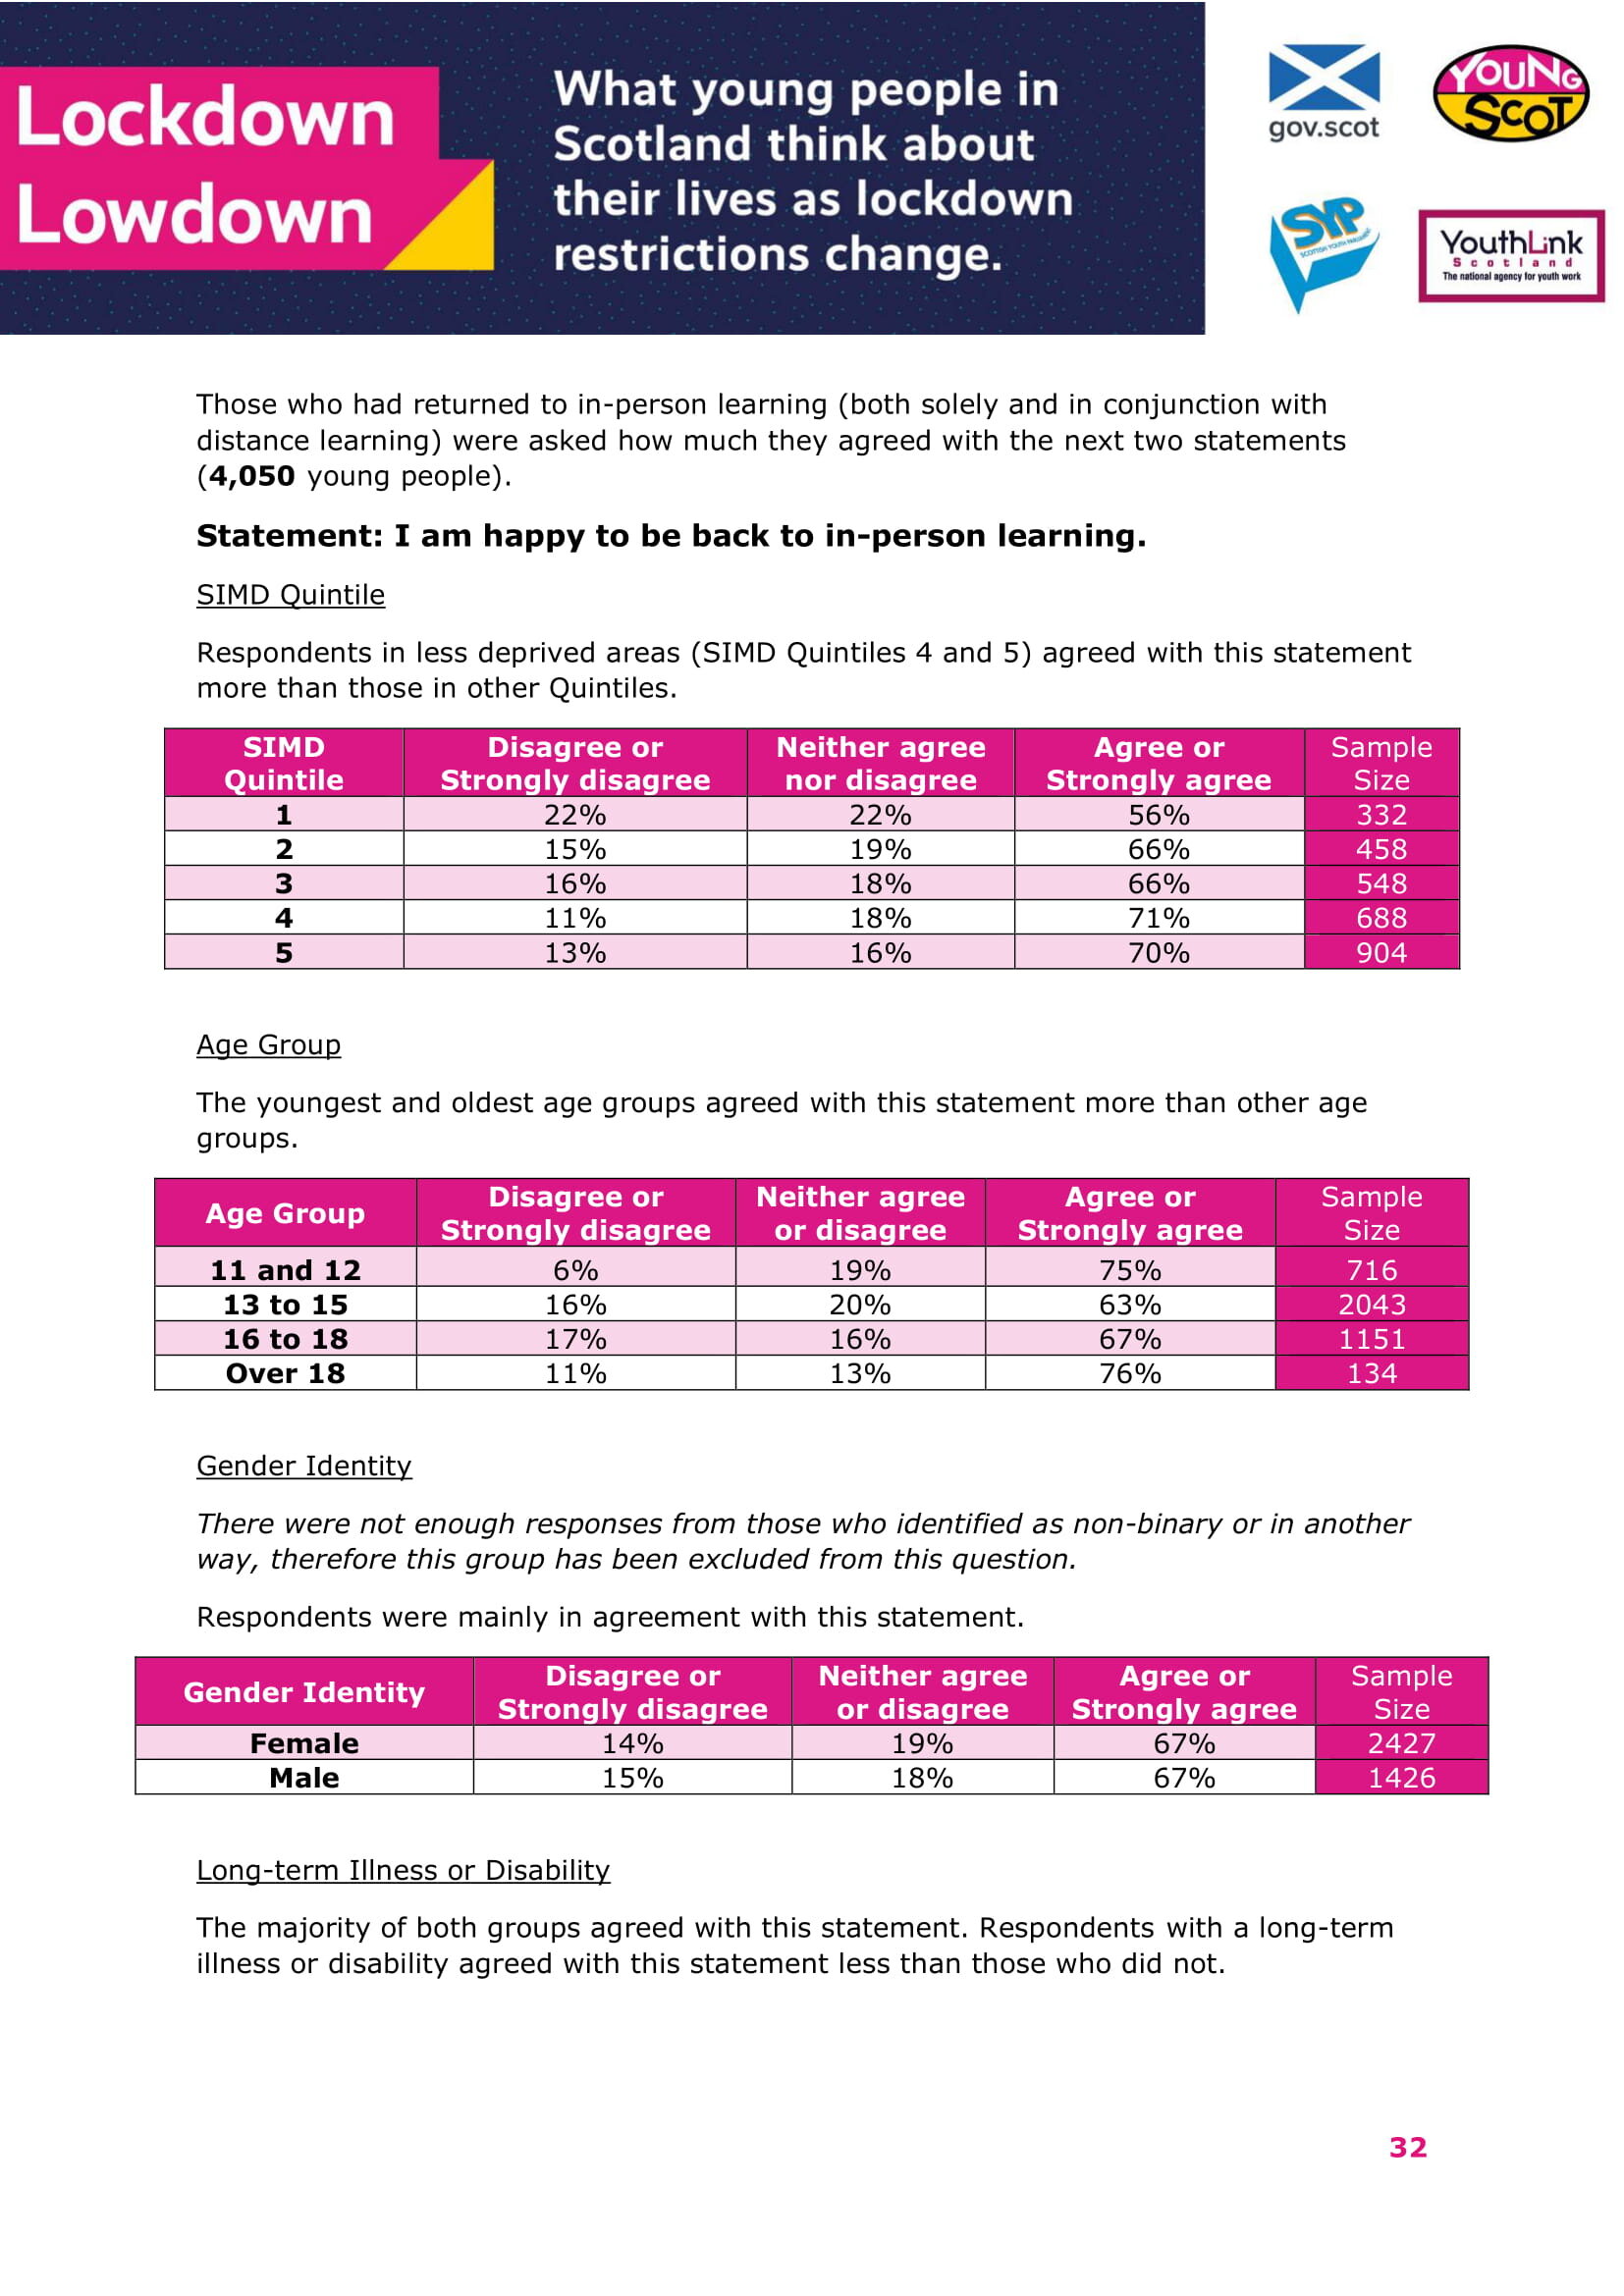
Those who had returned to in-person learning (both solely and in conjunction with distance learning) were asked how much they agreed with the next two statements (4,050 young people).
Statement: I am happy to be back to in-person learning.
SIMD Quintile
Respondents in less deprived areas (SIMD Quintiles 4 and 5) agreed with this statement more than those in other Quintiles.
SIMD Quintile Disagree or Strongly disagree Neither agree nor disagree Agree or Strongly agree Sample Size
1 22% 22% 56% 332
2 15% 19% 66% 458
3 16% 18% 66% 548
4 11% 18% 71% 688
5 13% 16% 70% 904
Age Group
The youngest and oldest age groups agreed with this statement more than other age groups.
Age Group Disagree or Strongly disagree Neither agree or disagree Agree or Strongly agree Sample Size
11 and 12 6% 19% 75% 716
13 to 15 16% 20% 63% 2043
16 to 18 17% 16% 67% 1151
Over 18 11% 13% 76% 134
Gender Identity
There were not enough responses from those who identified as non-binary or in another way, therefore this group has been excluded from this question.
Respondents were mainly in agreement with this statement.
Gender Identity Disagree or Strongly disagree Neither agree or disagree Agree or Strongly agree Sample Size
Female 14% 19% 67% 2427
Male 15% 18% 67% 1426
Long-term Illness or Disability
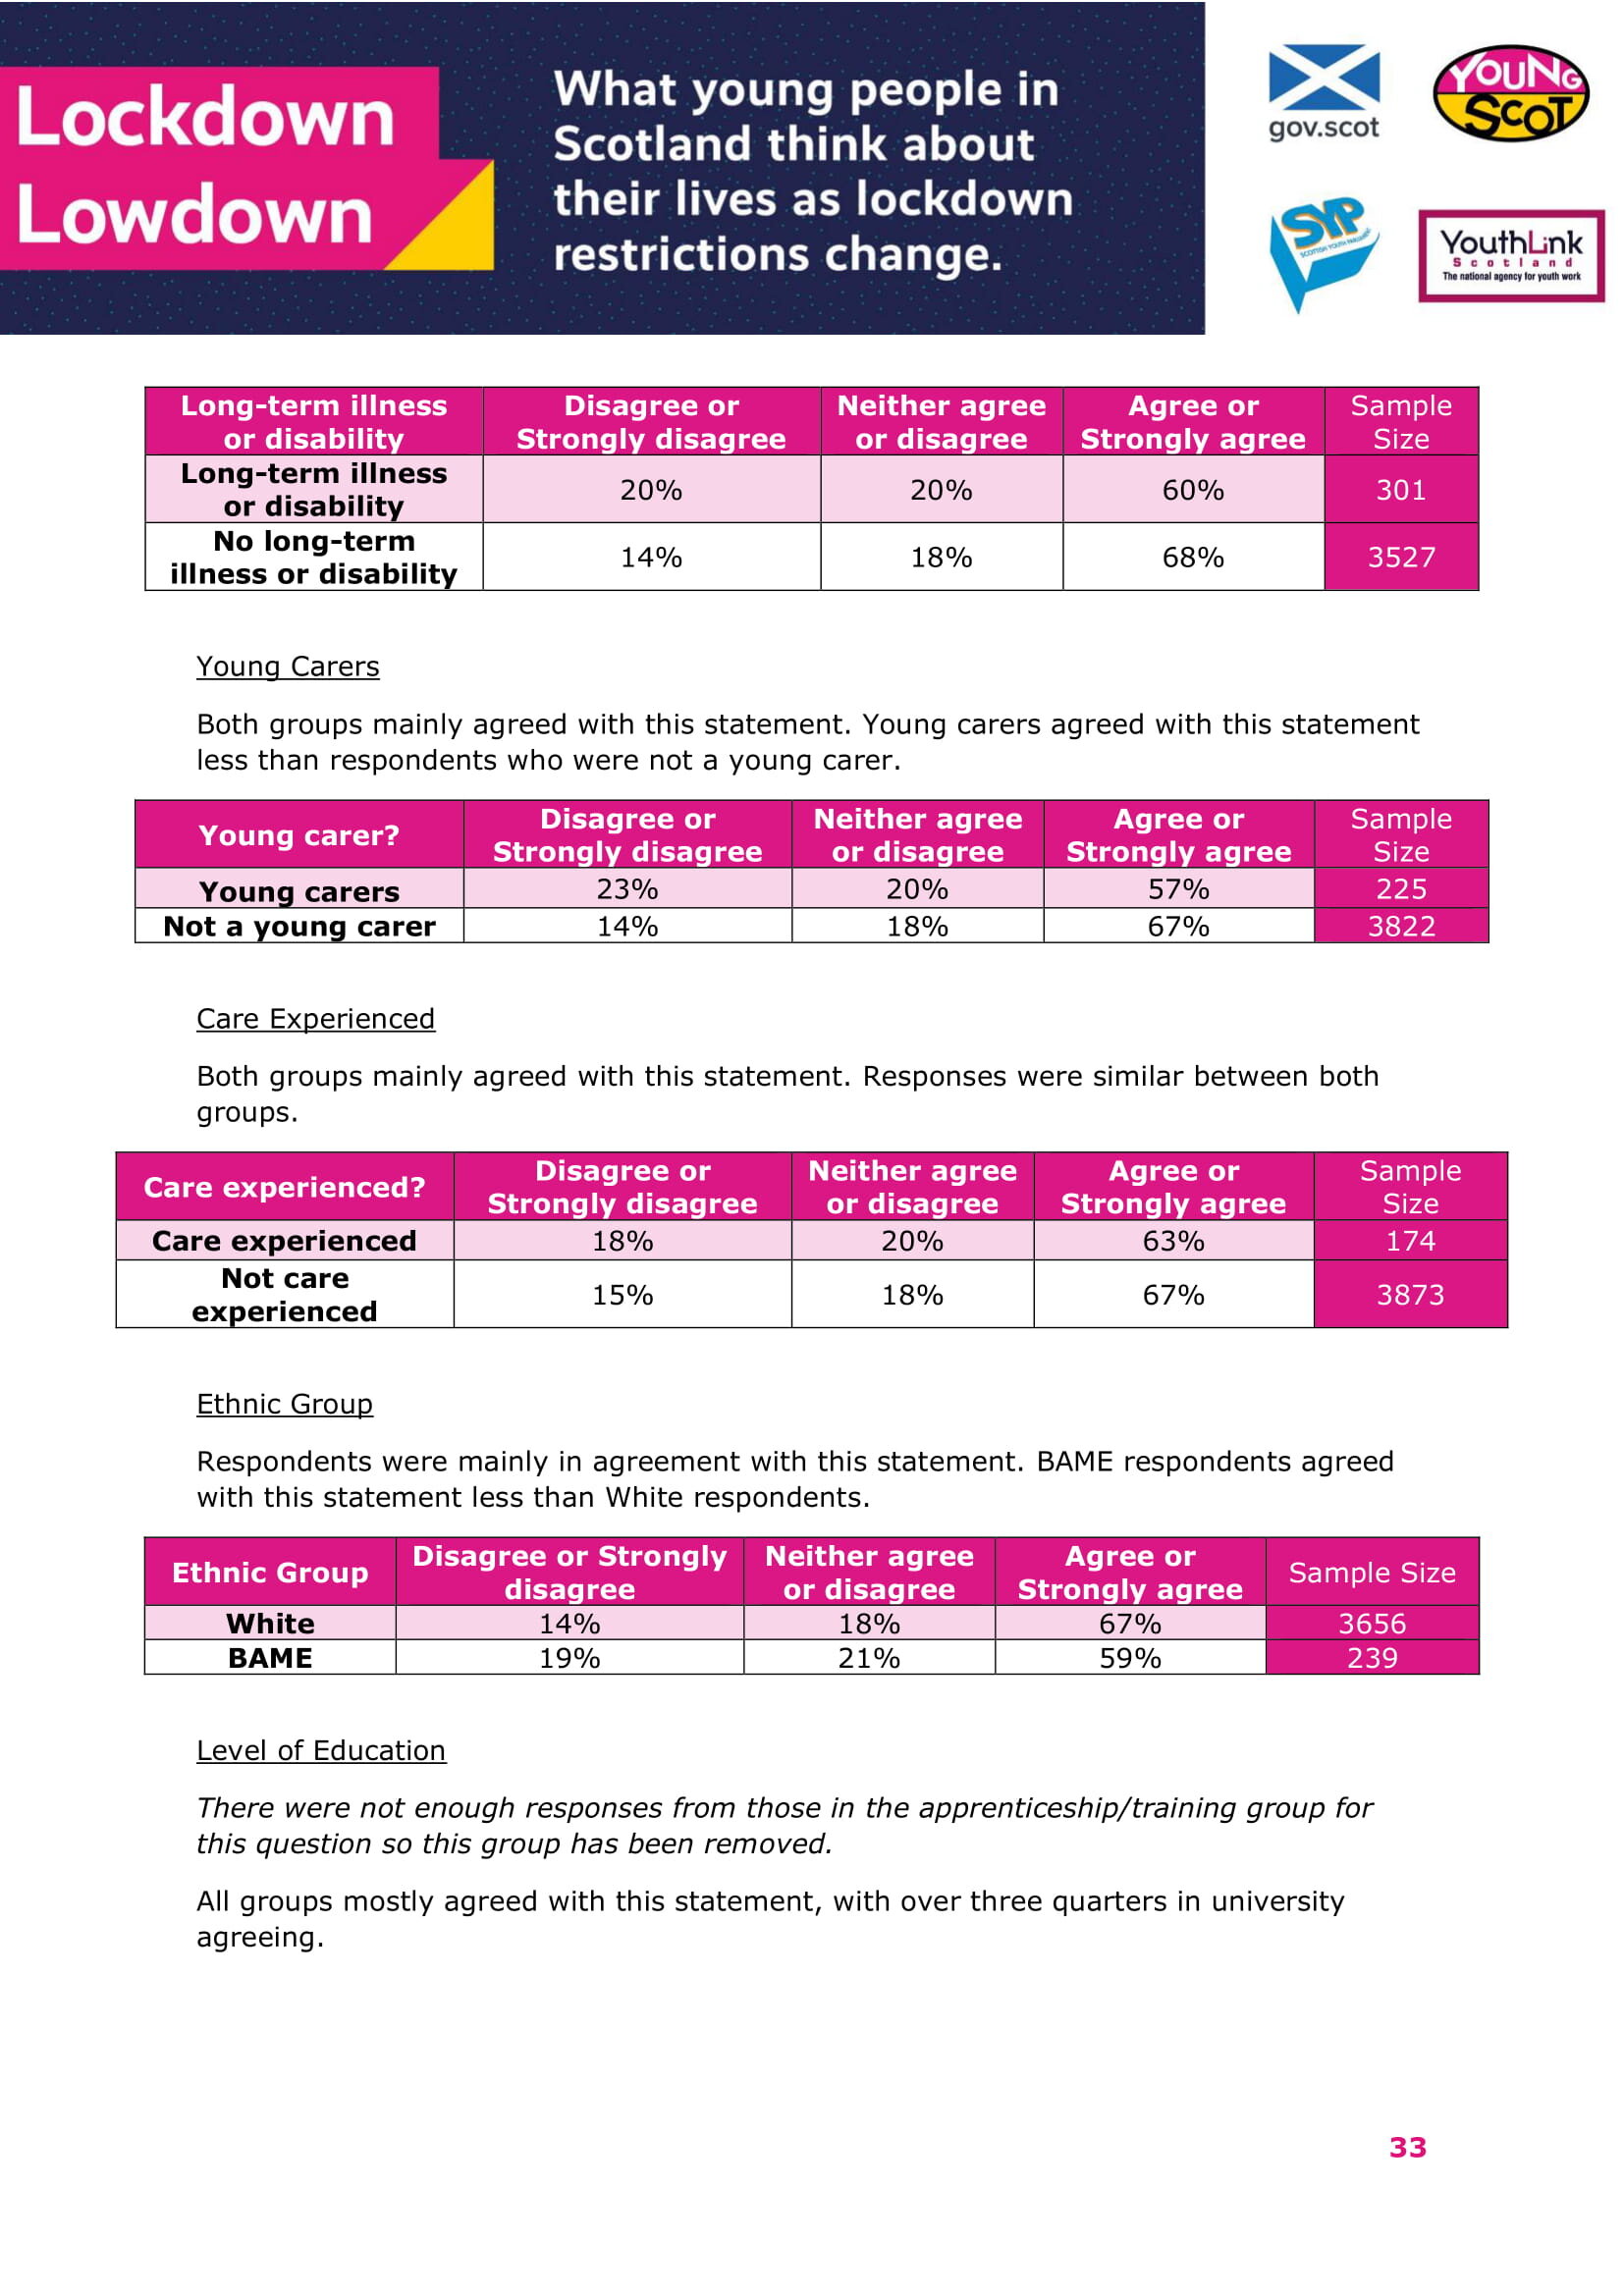
The majority of both groups agreed with this statement. Respondents with a long-term illness or disability agreed with this statement less than those who did not.
Long-term illness or disability Disagree or Strongly disagree Neither agree or disagree Agree or Strongly agree Sample Size
Long-term illness or disability 20% 20% 60% 301
No long-term illness or disability 14% 18% 68% 3527
Young Carers
Both groups mainly agreed with this statement. Young carers agreed with this statement less than respondents who were not a young carer.
Young carer? Disagree or Strongly disagree Neither agree or disagree Agree or Strongly agree Sample Size
Young carers 23% 20% 57% 225
Not a young carer 14% 18% 67% 3822
Care Experienced
Both groups mainly agreed with this statement. Responses were similar between both groups.
Care experienced? Disagree or Strongly disagree Neither agree or disagree Agree or Strongly agree Sample Size
Care experienced 18% 20% 63% 174
Not care experienced 15% 18% 67% 3873
Ethnic Group
Respondents were mainly in agreement with this statement. BAME respondents agreed with this statement less than White respondents.
Ethnic Group Disagree or Strongly disagree Neither agree or disagree Agree or Strongly agree Sample Size
White 14% 18% 67% 3656
BAME 19% 21% 59% 239
Level of Education
There were not enough responses from those in the apprenticeship/training group for this question so this group has been removed.
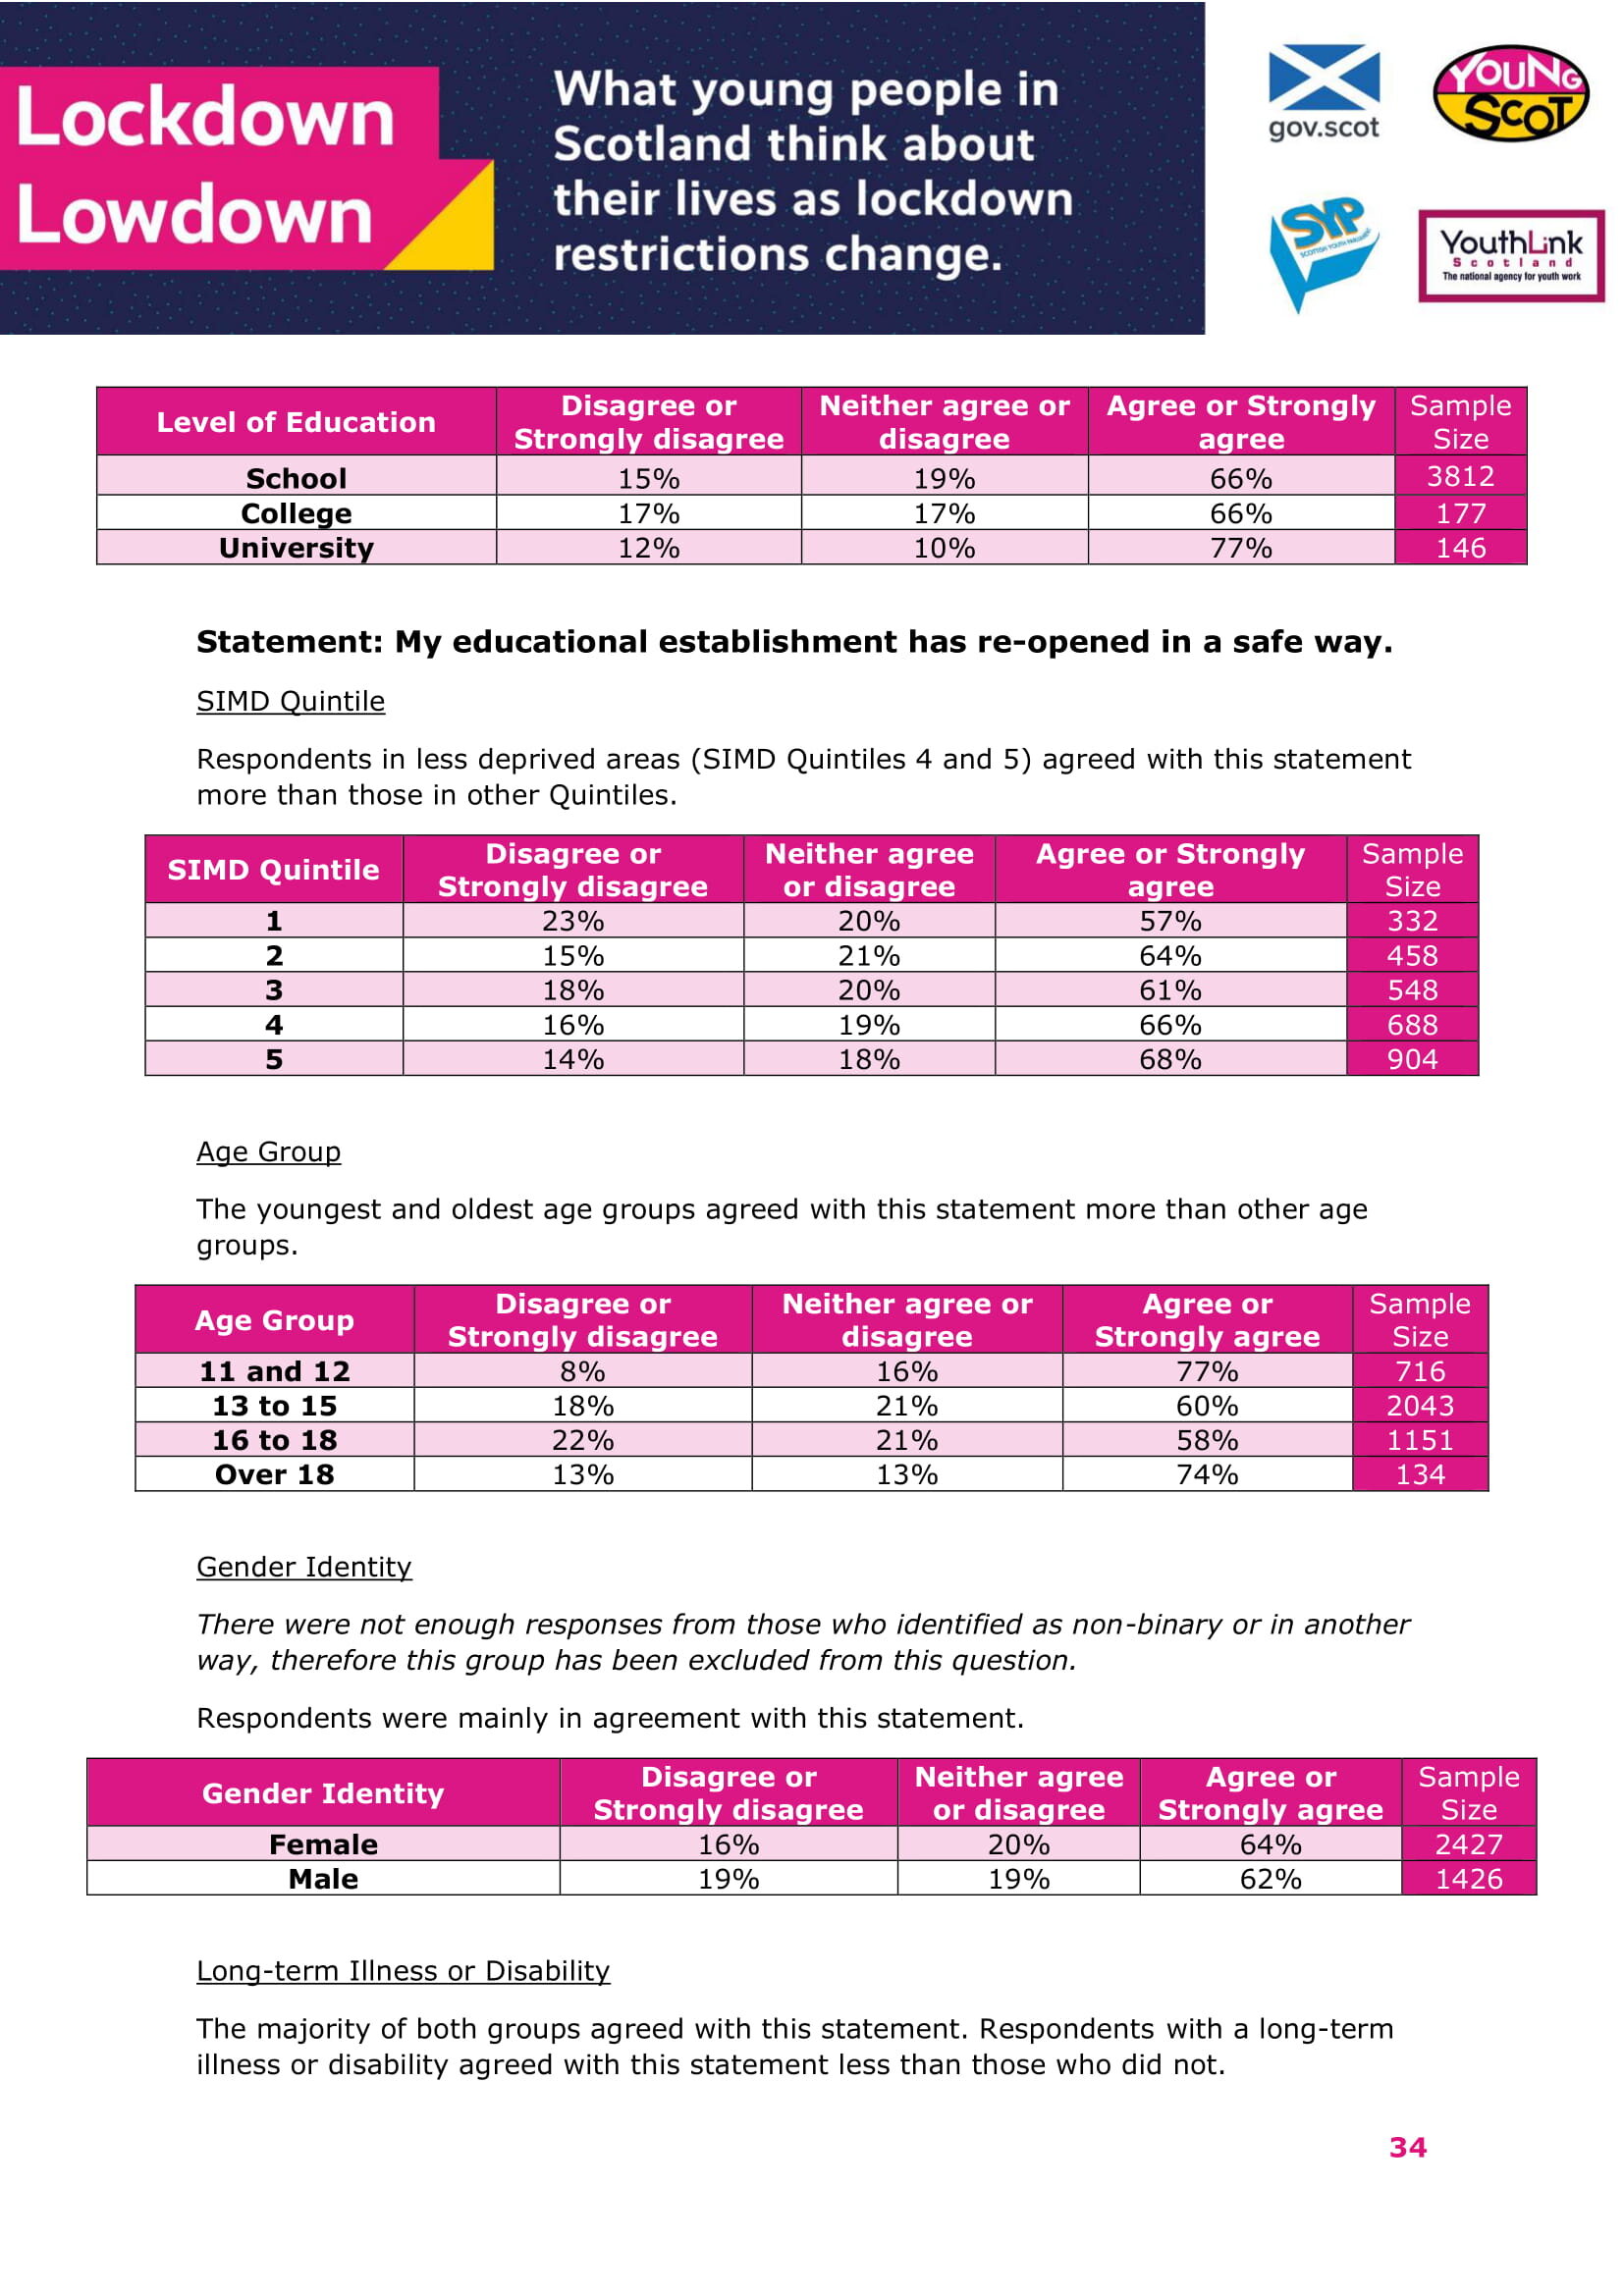
All groups mostly agreed with this statement, with over three quarters in university agreeing.
Level of Education Disagree or Strongly disagree Neither agree or disagree Agree or Strongly agree Sample Size
School 15% 19% 66% 3812
College 17% 17% 66% 177
University 12% 10% 77% 146
Statement: My educational establishment has re-opened in a safe way.
SIMD Quintile
Respondents in less deprived areas (SIMD Quintiles 4 and 5) agreed with this statement more than those in other Quintiles.
SIMD Quintile Disagree or Strongly disagree Neither agree or disagree Agree or Strongly agree Sample Size
1 23% 20% 57% 332
2 15% 21% 64% 458
3 18% 20% 61% 548
4 16% 19% 66% 688
5 14% 18% 68% 904
Age Group
The youngest and oldest age groups agreed with this statement more than other age groups.
Age Group Disagree or Strongly disagree Neither agree or disagree Agree or Strongly agree Sample Size
11 and 12 8% 16% 77% 716
13 to 15 18% 21% 60% 2043
16 to 18 22% 21% 58% 1151
Over 18 13% 13% 74% 134
Gender Identity
There were not enough responses from those who identified as non-binary or in another way, therefore this group has been excluded from this question.
Respondents were mainly in agreement with this statement.
Gender Identity Disagree or Strongly disagree Neither agree or disagree Agree or Strongly agree Sample Size
Female 16% 20% 64% 2427
Male 19% 19% 62% 1426
Long-term Illness or Disability
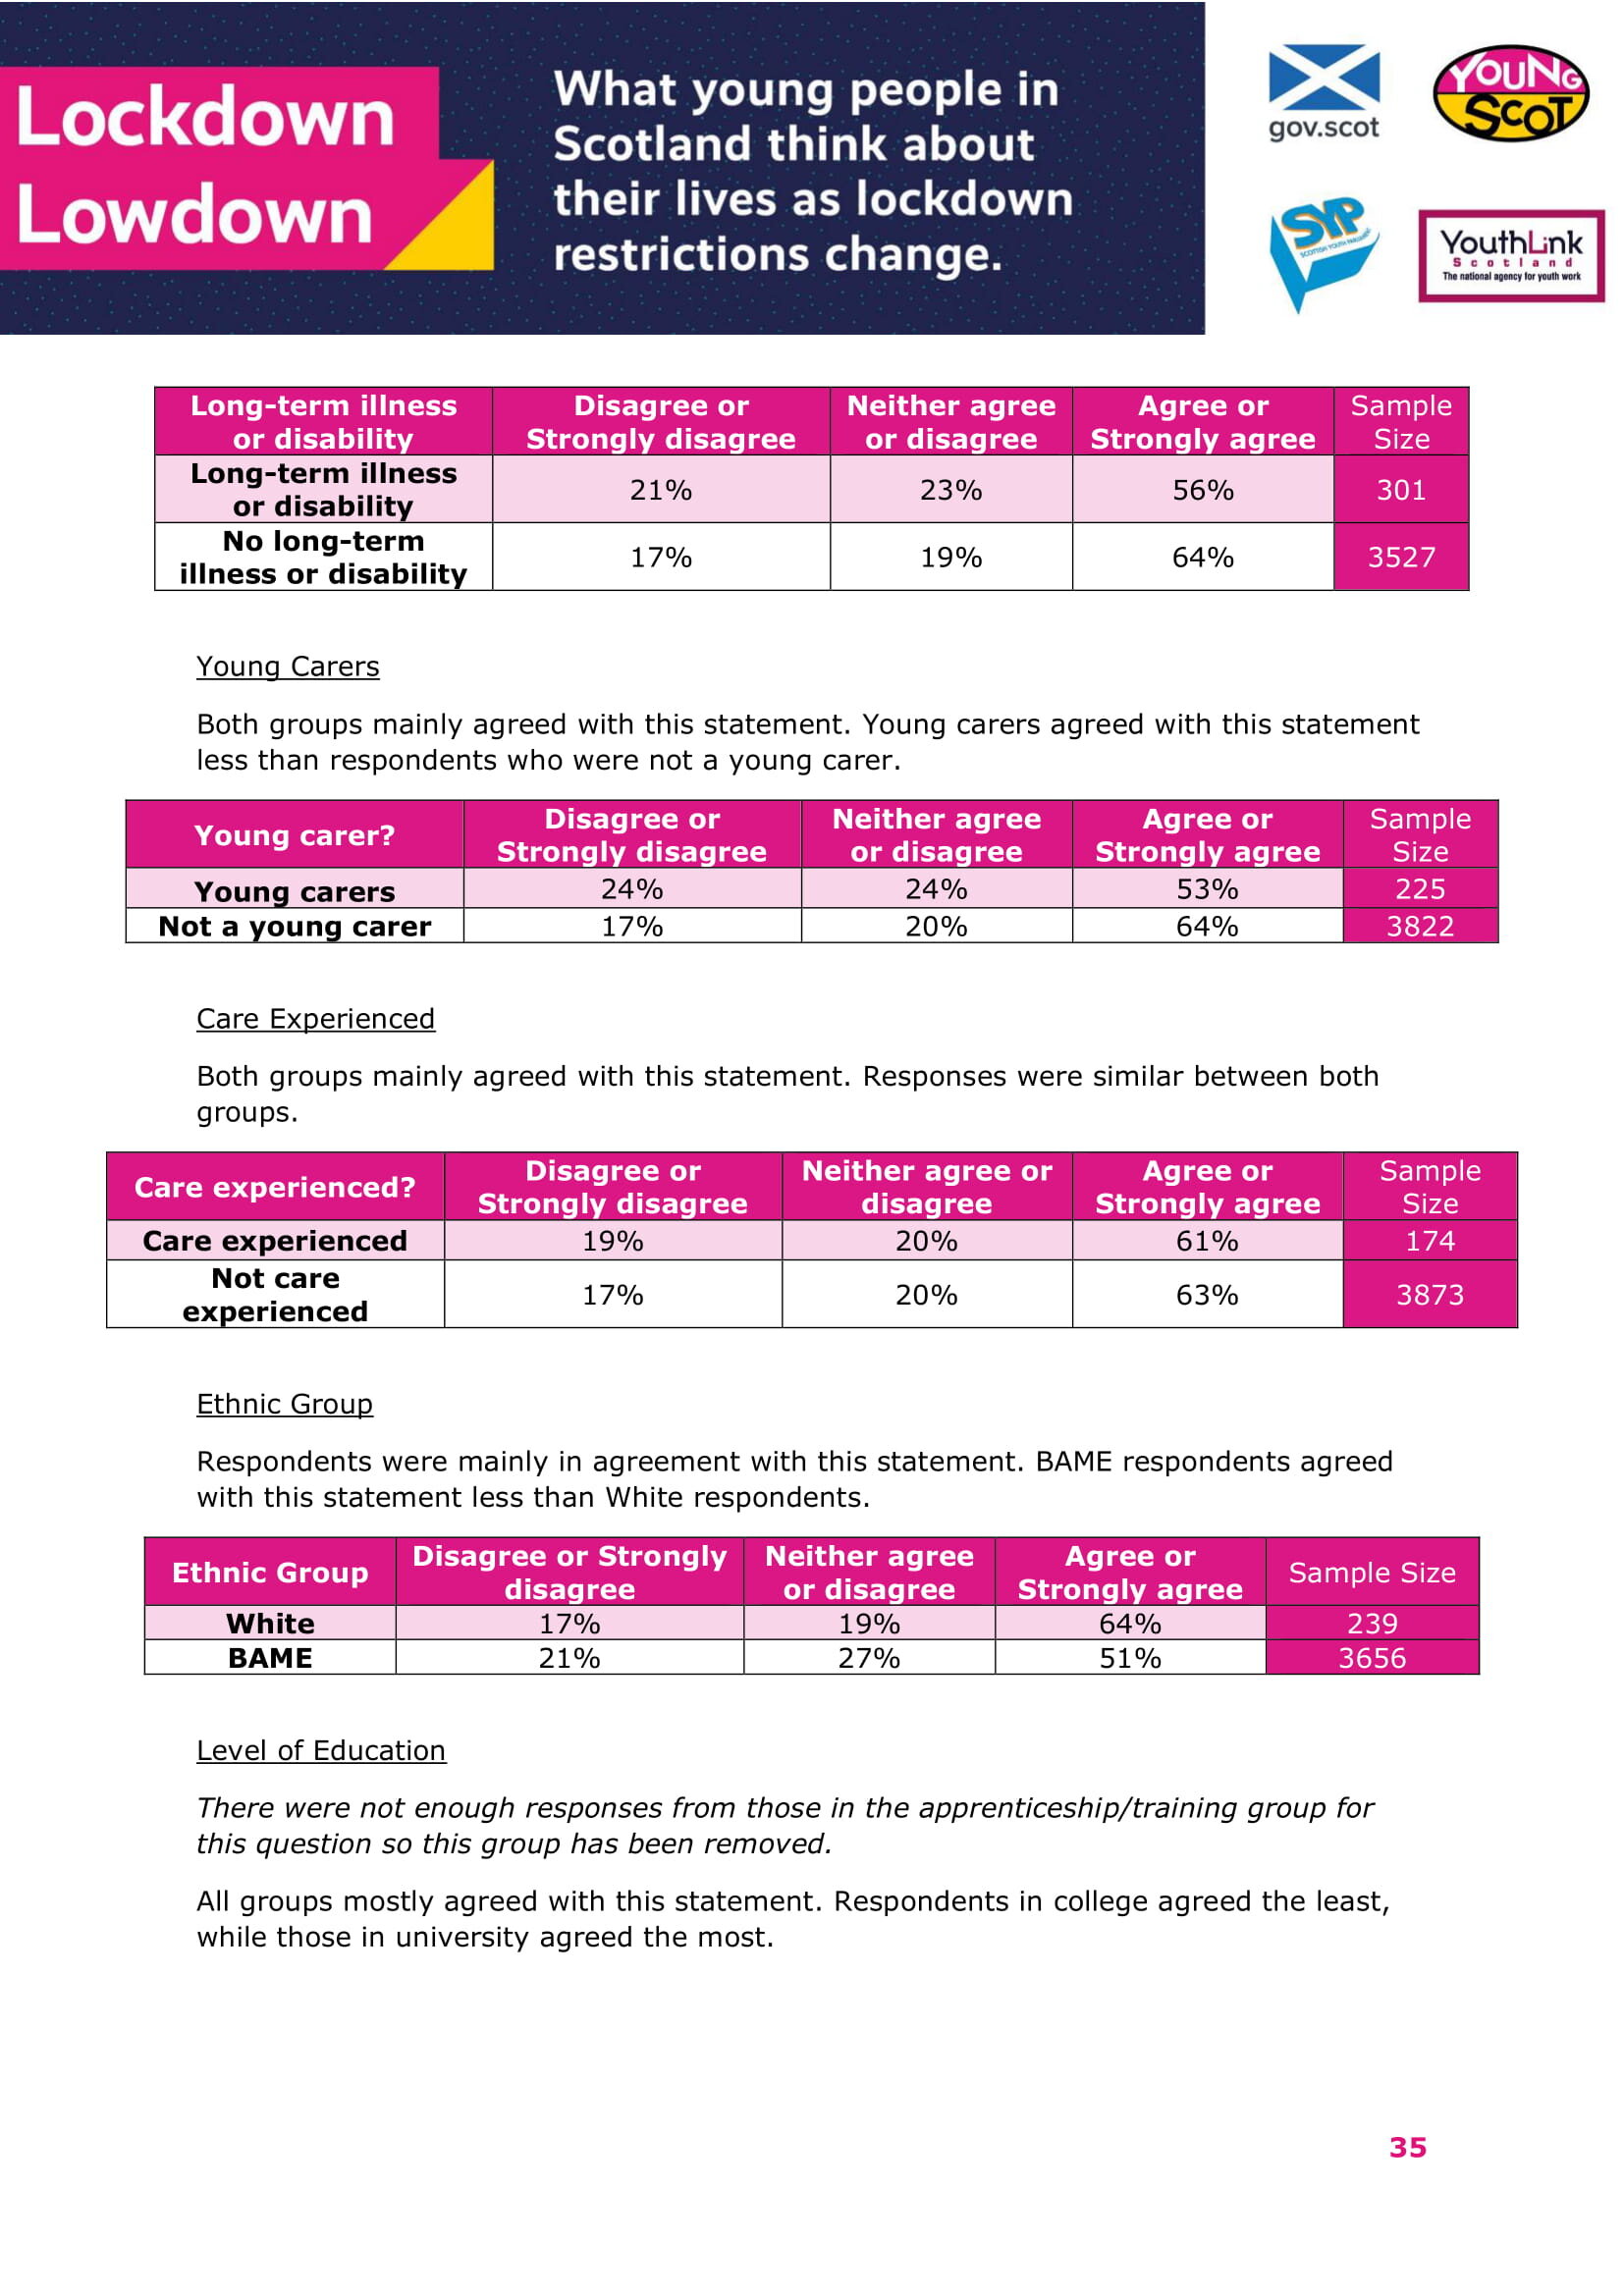
The majority of both groups agreed with this statement. Respondents with a long-term illness or disability agreed with this statement less than those who did not.
Long-term illness or disability Disagree or Strongly disagree Neither agree or disagree Agree or Strongly agree Sample Size
Long-term illness or disability 21% 23% 56% 301
No long-term illness or disability 17% 19% 64% 3527
Young Carers
Both groups mainly agreed with this statement. Young carers agreed with this statement less than respondents who were not a young carer.
Young carer? Disagree or Strongly disagree Neither agree or disagree Agree or Strongly agree Sample Size
Young carers 24% 24% 53% 225
Not a young carer 17% 20% 64% 3822
Care Experienced
Both groups mainly agreed with this statement. Responses were similar between both groups.
Care experienced? Disagree or Strongly disagree Neither agree or disagree Agree or Strongly agree Sample Size
Care experienced 19% 20% 61% 174
Not care experienced 17% 20% 63% 3873
Ethnic Group
Respondents were mainly in agreement with this statement. BAME respondents agreed with this statement less than White respondents.
Ethnic Group Disagree or Strongly disagree Neither agree or disagree Agree or Strongly agree Sample Size
White 17% 19% 64% 239
BAME 21% 27% 51% 3656
Level of Education
There were not enough responses from those in the apprenticeship/training group for this question so this group has been removed.
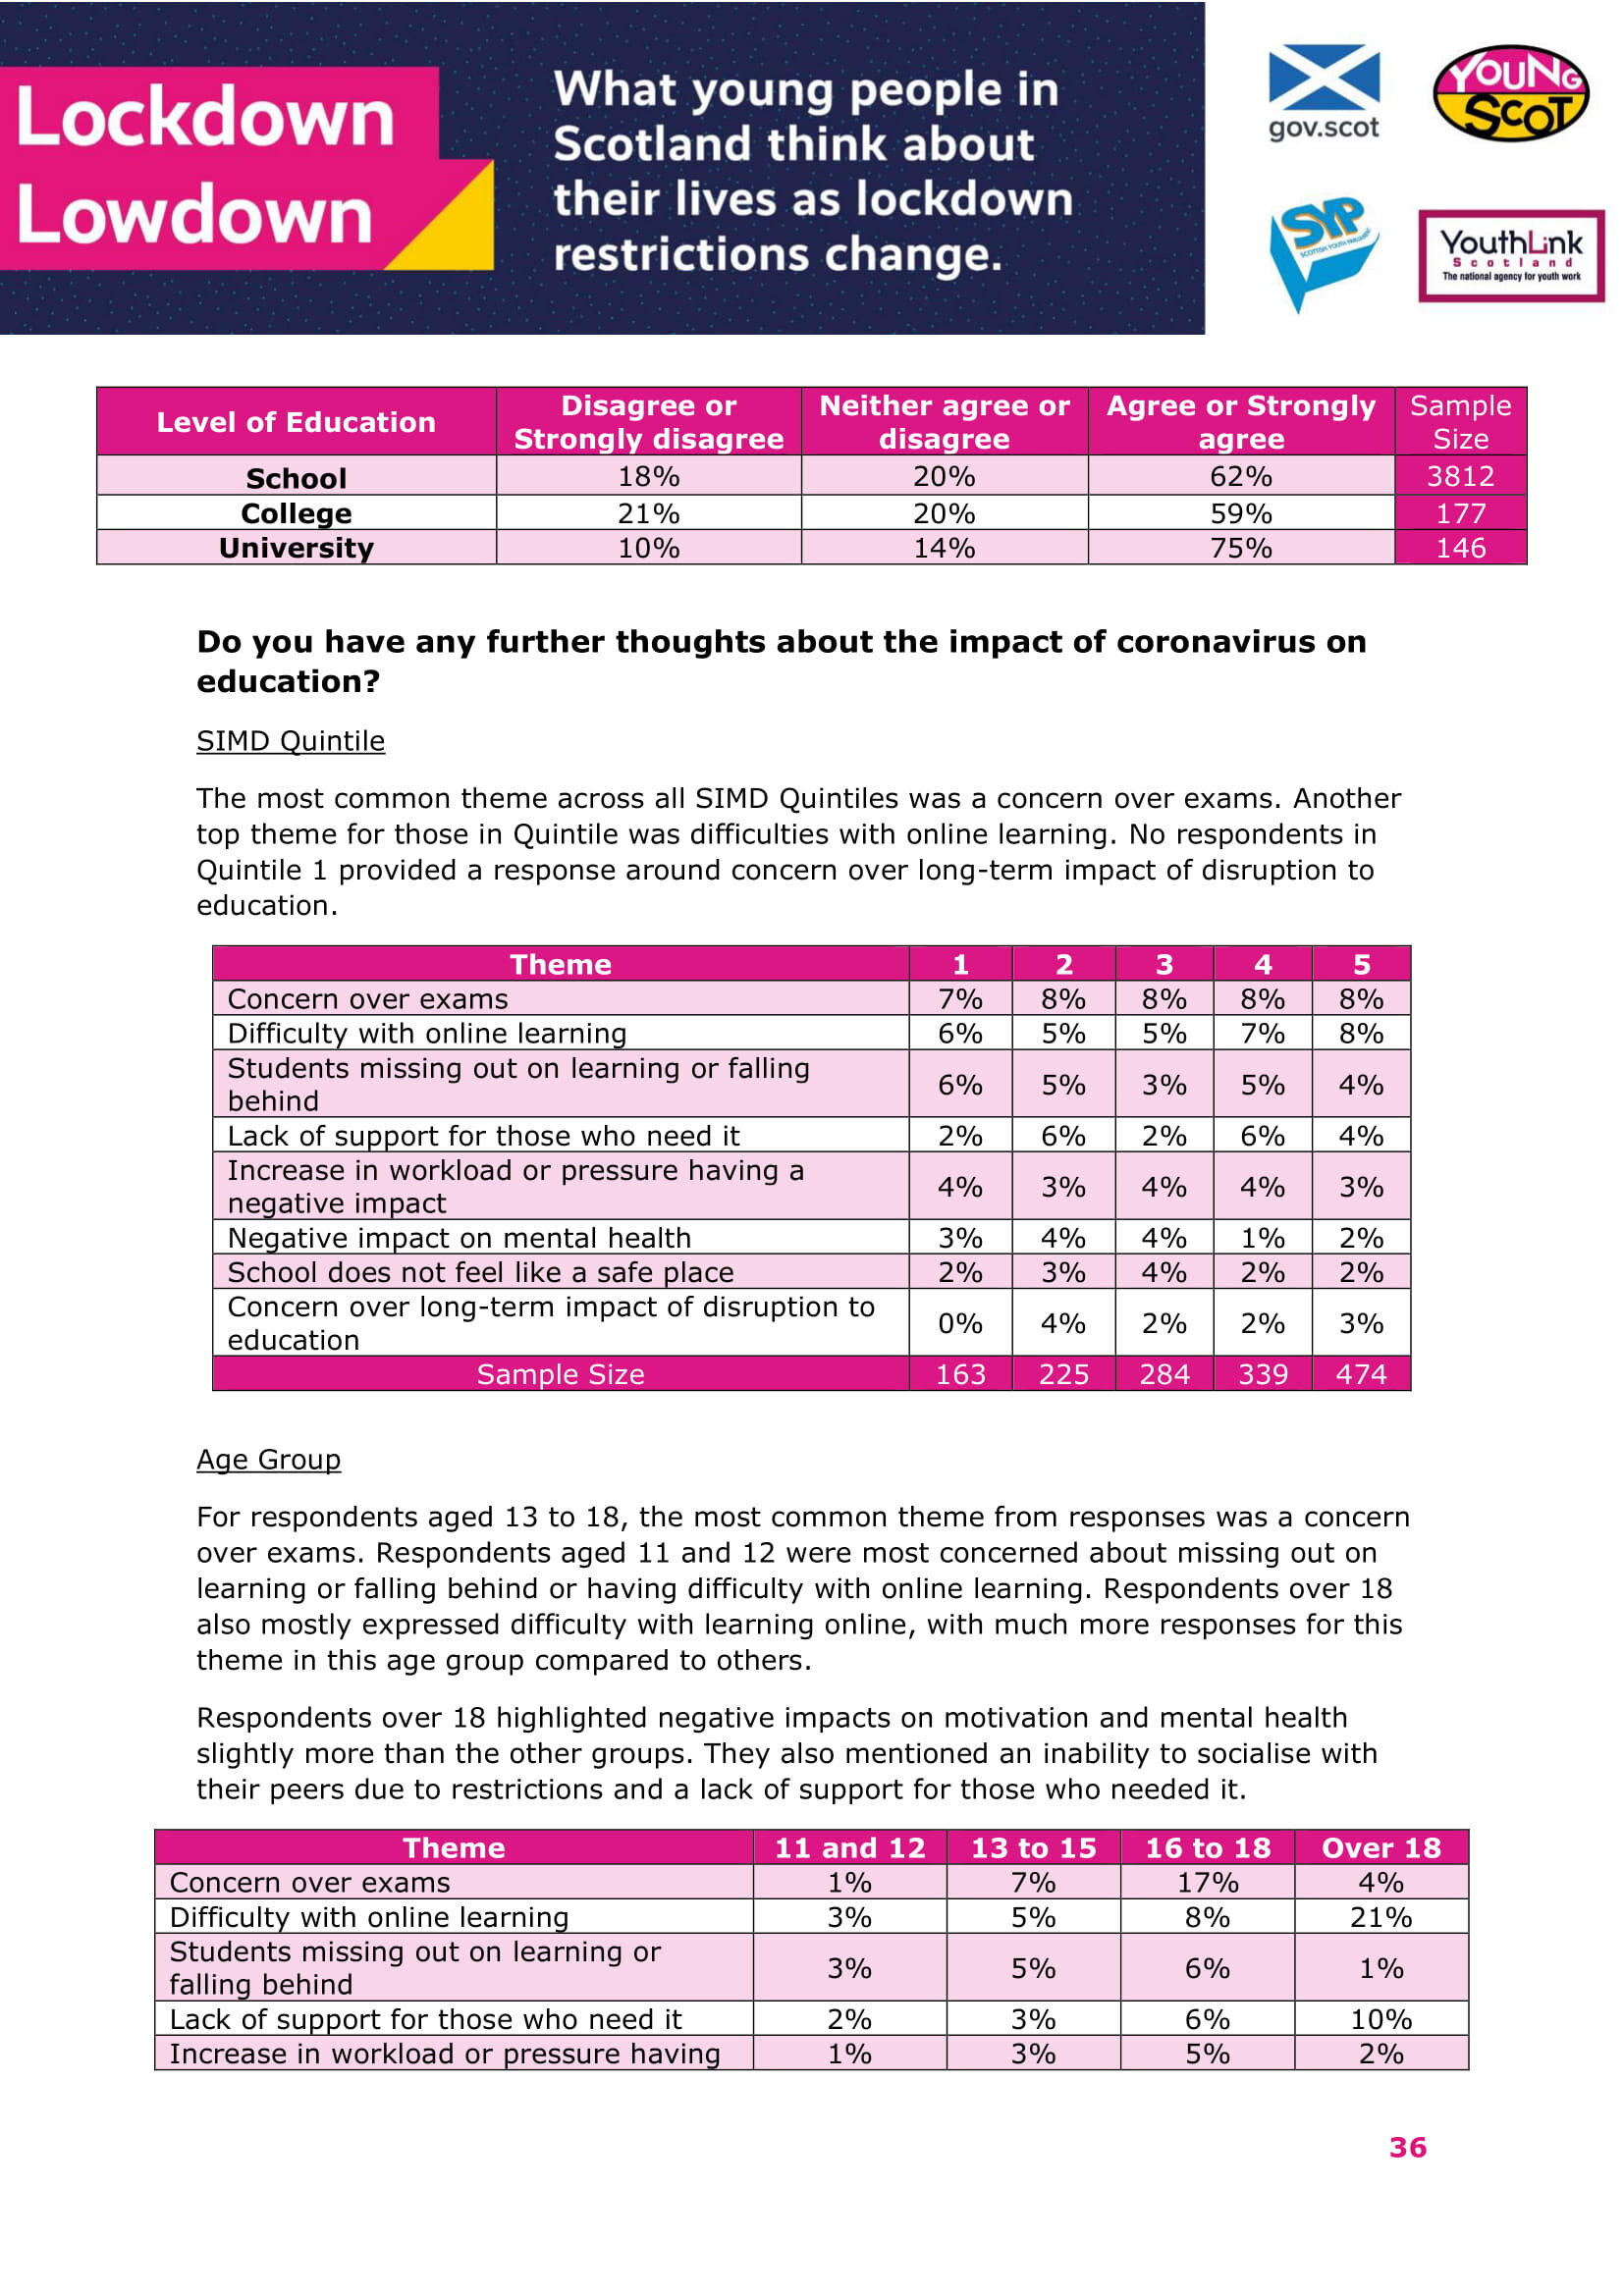
All groups mostly agreed with this statement. Respondents in college agreed the least, while those in university agreed the most.
Level of Education Disagree or Strongly disagree Neither agree or disagree Agree or Strongly agree Sample Size
School 18% 20% 62% 3812
College 21% 20% 59% 177
University 10% 14% 75% 146
Do you have any further thoughts about the impact of coronavirus on education?
SIMD Quintile
The most common theme across all SIMD Quintiles was a concern over exams. Another top theme for those in Quintile was difficulties with online learning. No respondents in Quintile 1 provided a response around concern over long-term impact of disruption to education.
Theme 1 2 3 4 5
Concern over exams 7% 8% 8% 8% 8%
Difficulty with online learning 6% 5% 5% 7% 8%
Students missing out on learning or falling behind 6% 5% 3% 5% 4%
Lack of support for those who need it 2% 6% 2% 6% 4%
Increase in workload or pressure having a negative impact 4% 3% 4% 4% 3%
Negative impact on mental health 3% 4% 4% 1% 2%
School does not feel like a safe place 2% 3% 4% 2% 2%
Concern over long-term impact of disruption to education 0% 4% 2% 2% 3%
Sample Size 163 225 284 339 474
Age Group
For respondents aged 13 to 18, the most common theme from responses was a concern over exams. Respondents aged 11 and 12 were most concerned about missing out on learning or falling behind or having difficulty with online learning. Respondents over 18 also mostly expressed difficulty with learning online, with much more responses for this theme in this age group compared to others.
Respondents over 18 highlighted negative impacts on motivation and mental health slightly more than the other groups. They also mentioned an inability to socialise with their peers due to restrictions and a lack of support for those who needed it.
Theme 11 and 12 13 to 15 16 to 18 Over 18
Concern over exams 1% 7% 17% 4%
Difficulty with online learning 3% 5% 8% 21%
Students missing out on learning or falling behind 3% 5% 6% 1%
Lack of support for those who need it 2% 3% 6% 10%
Increase in workload or pressure having a negative impact 1% 3% 5% 2%
School does not feel like a safe place 2% 2% 4% 1%
Concern over long-term impact of disruption to education 1% 1% 3% 7%
Negative impact on motivation 1% 1% 3% 12%
Negative impact on mental health 1% 1% 3% 10%
Unable to socialise with peers 1% 1% 3% 11%
Sample Size 369 938 510 178
Gender Identity
There were not enough responses from those who identified as non-binary or in another way for this question so this group has been removed.
The top theme both groups of respondents was concern over exams, with female respondents expressing this more than male. Responses were fairly similar across both groups.
Theme Female Male
Concern over exams 11% 5%
Difficulty with online learning 7% 7%
Students missing out on learning or falling behind 6% 3%
Lack of support for those who need it 5% 3%
Increase in workload or pressure having a negative impact 4% 2%
School does not feel like a safe place 2% 2%
Concern over long-term impact of disruption to education 3% 2%
Negative impact on motivation 3% 2%
Negative impact on mental health 3% 2%
Unable to socialise with peers 3% 2%
In-person learning preferred 2% 3%
Sample Size 1169 721
Long-term Illness or Disability
The top theme for respondents with a long-term illness or disability was expressing difficulties with online learning. For respondents with no long-term illness or disability, the most prominent theme was a concern over exams. Those with a long-term illness or disability discussed a negative impact on their mental health more than those who did not.
Theme Long-term illness or disability No long-term illness or disability
Concern over exams 6% 9%
Difficulty with online learning 8% 6%
Students missing out on learning or falling behind 5% 5%
Lack of support for those who need it 7% 4%
Increase in workload or pressure having a negative impact 5% 3%
School does not feel like a safe place 3% 2%
Concern over long-term impact of disruption to education 3% 2%
Negative impact on motivation 3% 2%
Negative impact on mental health 7% 2%
Unable to socialise with peers 5% 2%
Sample Size 176 1695
Young Carers
The top theme for both groups was concern over exams. Respondents who were young carers mentioned a lack of support for those who need it slightly more than those who were not a young carer.
Theme Young carers Not a young carer
Concern over exams 10% 8%
Difficulty with online learning 9% 6%
Students missing out on learning or falling behind 4% 5%
Lack of support for those who need it 8% 4%
Increase in workload or pressure having a negative impact 4% 3%
School does not feel like a safe place 3% 3%
Concern over long-term impact of disruption to education 1% 3%
Negative impact on motivation 1% 3%
Negative impact on mental health 2% 2%
Unable to socialise with peers 3% 2%
Sample Size 125 1872
Care Experienced
The top theme for respondents who were care experienced was difficulty with online learning (which was mentioned more than the other group). The top theme for those who were not care experienced was concern over exams.
Theme Care experienced Not care experienced
Concern over exams 9% 8%
Difficulty with online learning 11% 6%
Students missing out on learning or falling behind 3% 5%
Lack of support for those who need it 4% 4%
Increase in workload or pressure having a negative impact 6% 3%
School does not feel like a safe place 1% 3%
Concern over long-term impact of disruption to education 1% 3%
Negative impact on motivation 3% 2%
Negative impact on mental health 3% 2%
Sample Size 101 1896
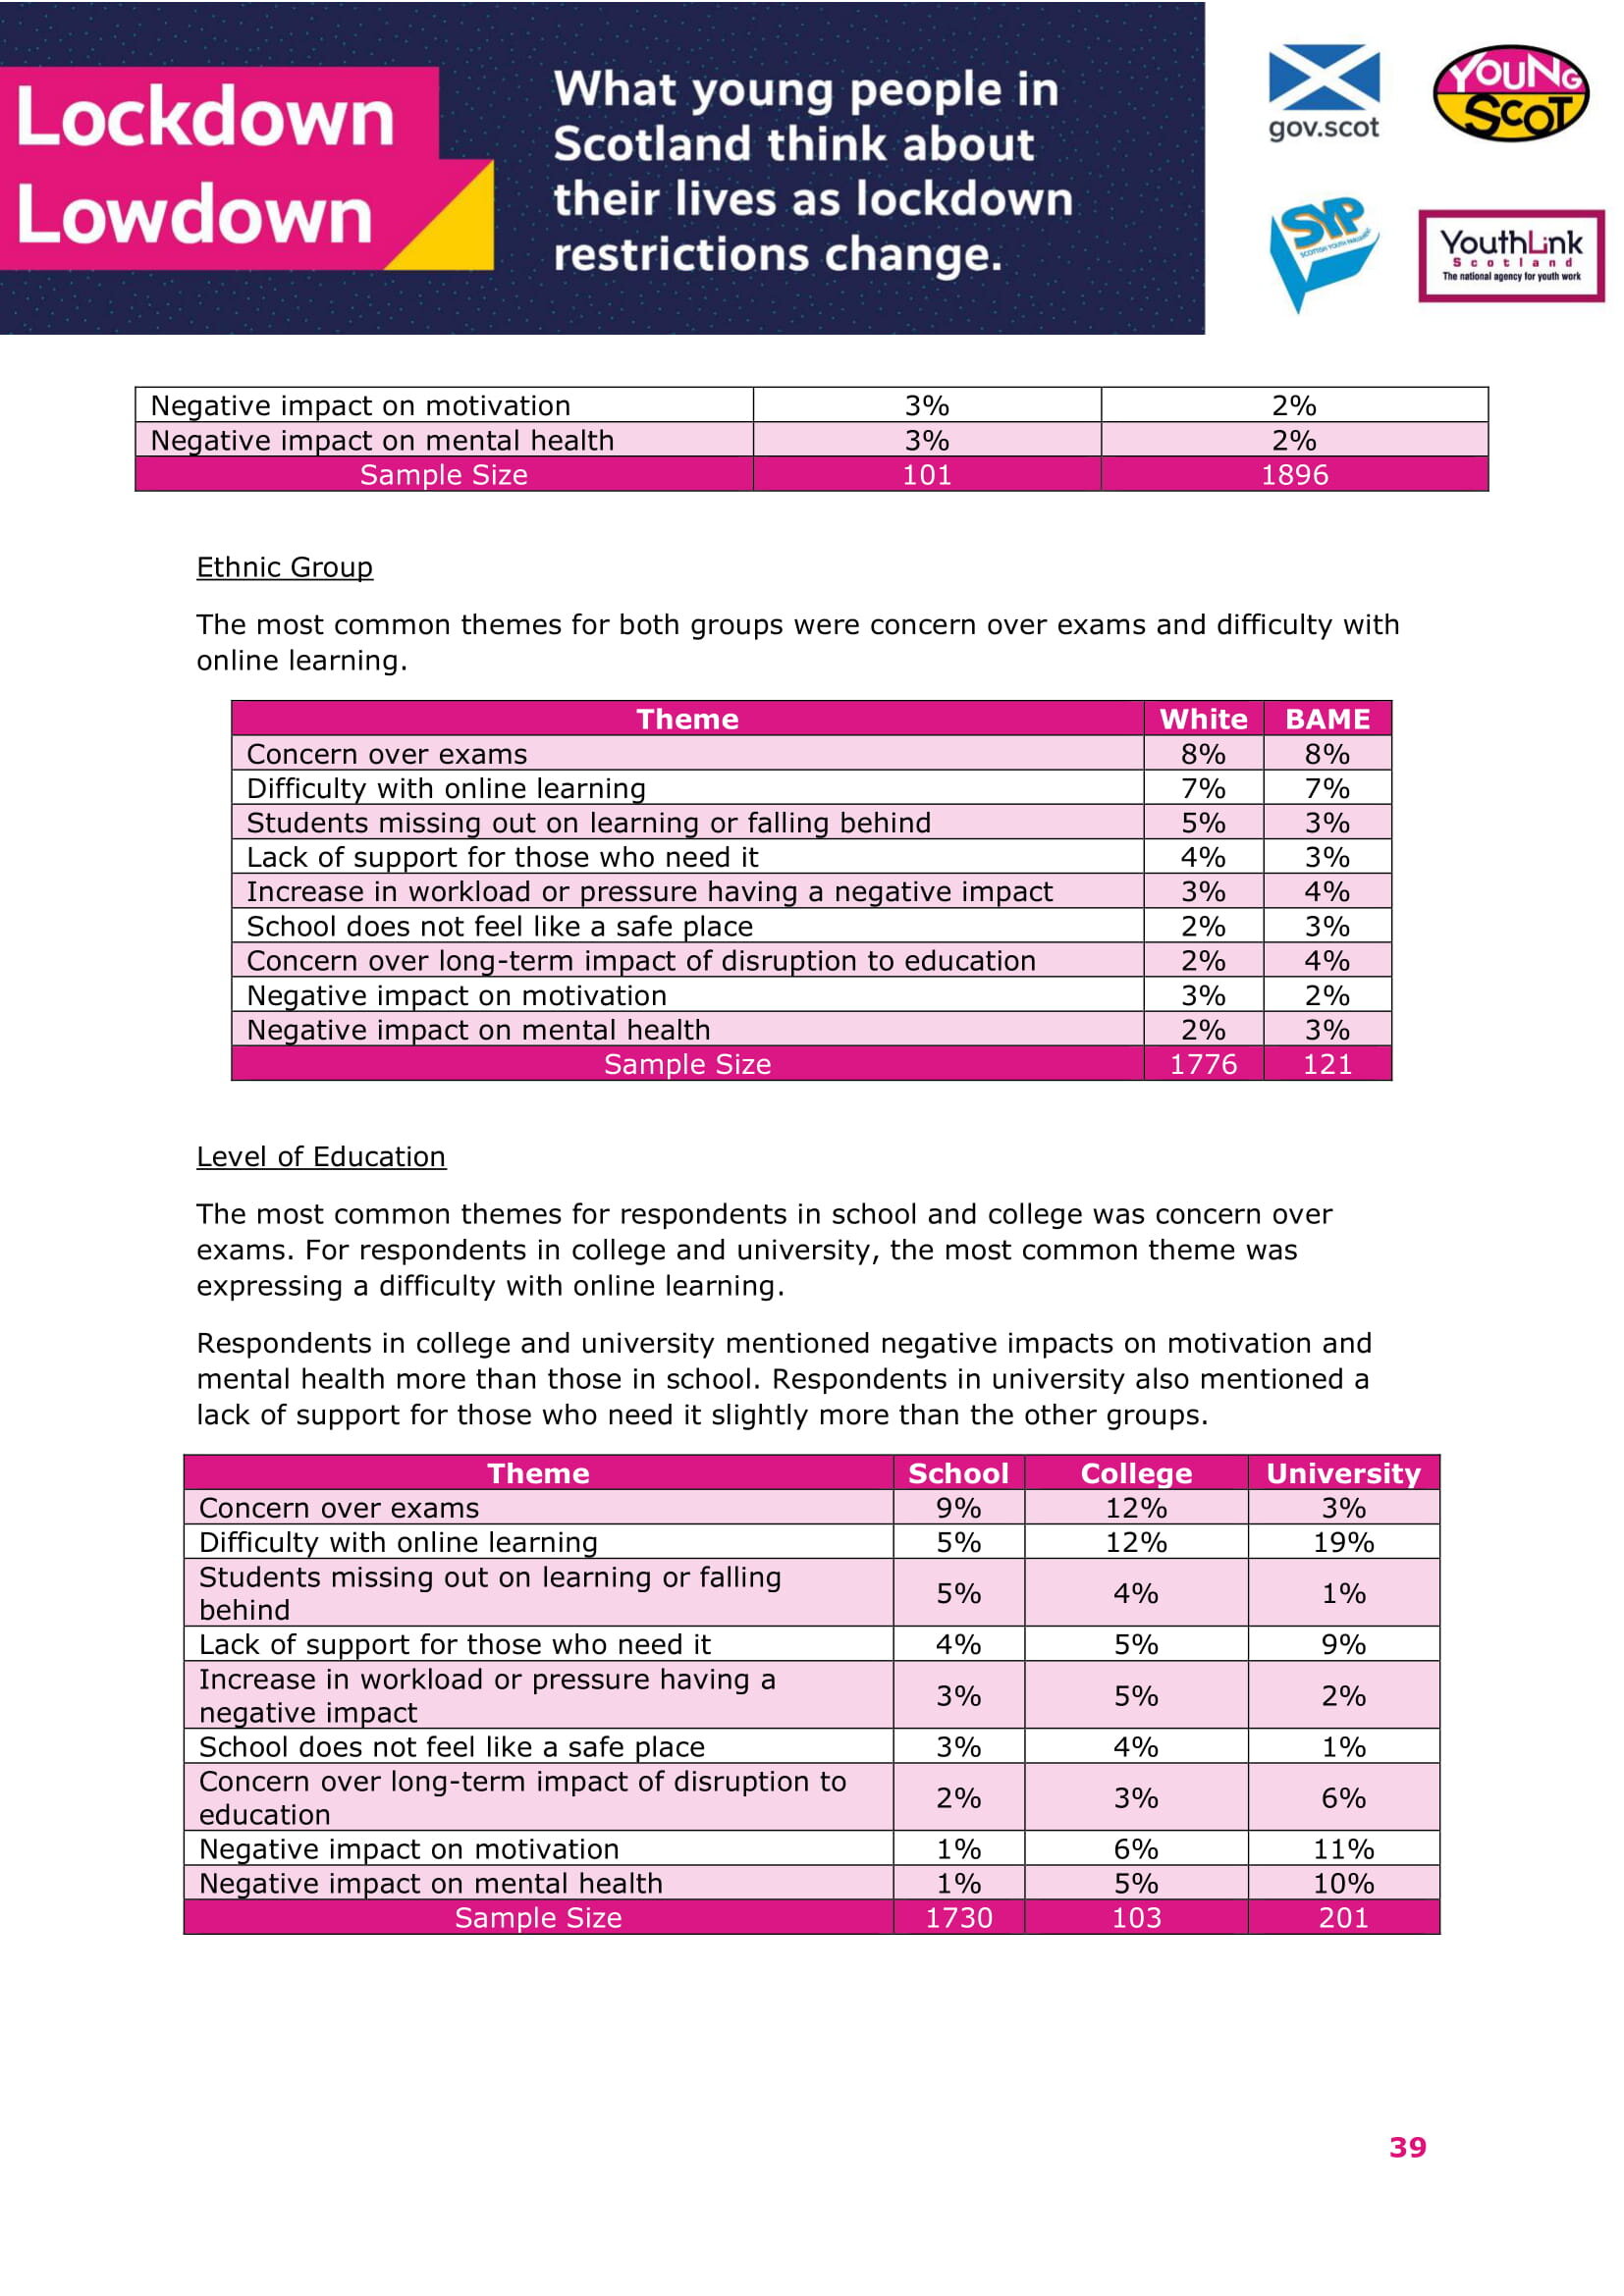
Ethnic Group
The most common themes for both groups were concern over exams and difficulty with online learning.
Theme White BAME
Concern over exams 8% 8%
Difficulty with online learning 7% 7%
Students missing out on learning or falling behind 5% 3%
Lack of support for those who need it 4% 3%
Increase in workload or pressure having a negative impact 3% 4%
School does not feel like a safe place 2% 3%
Concern over long-term impact of disruption to education 2% 4%
Negative impact on motivation 3% 2%
Negative impact on mental health 2% 3%
Sample Size 1776 121
Level of Education
The most common themes for respondents in school and college was concern over exams. For respondents in college and university, the most common theme was expressing a difficulty with online learning.
Respondents in college and university mentioned negative impacts on motivation and mental health more than those in school. Respondents in university also mentioned a lack of support for those who need it slightly more than the other groups.
Theme School College University
Concern over exams 9% 12% 3%
Difficulty with online learning 5% 12% 19%
Students missing out on learning or falling behind 5% 4% 1%
Lack of support for those who need it 4% 5% 9%
Increase in workload or pressure having a negative impact 3% 5% 2%
School does not feel like a safe place 3% 4% 1%
Concern over long-term impact of disruption to education 2% 3% 6%
Negative impact on motivation 1% 6% 11%
Negative impact on mental health 1% 5% 10%
Sample Size 1730 103 201
Impact of coronavirus on your relationships by demographic
The following questions are about the current state of young people's relationships. This is to track any changes between this survey and future iterations.
All respondents were asked to rate how much they agreed with the following two statements.
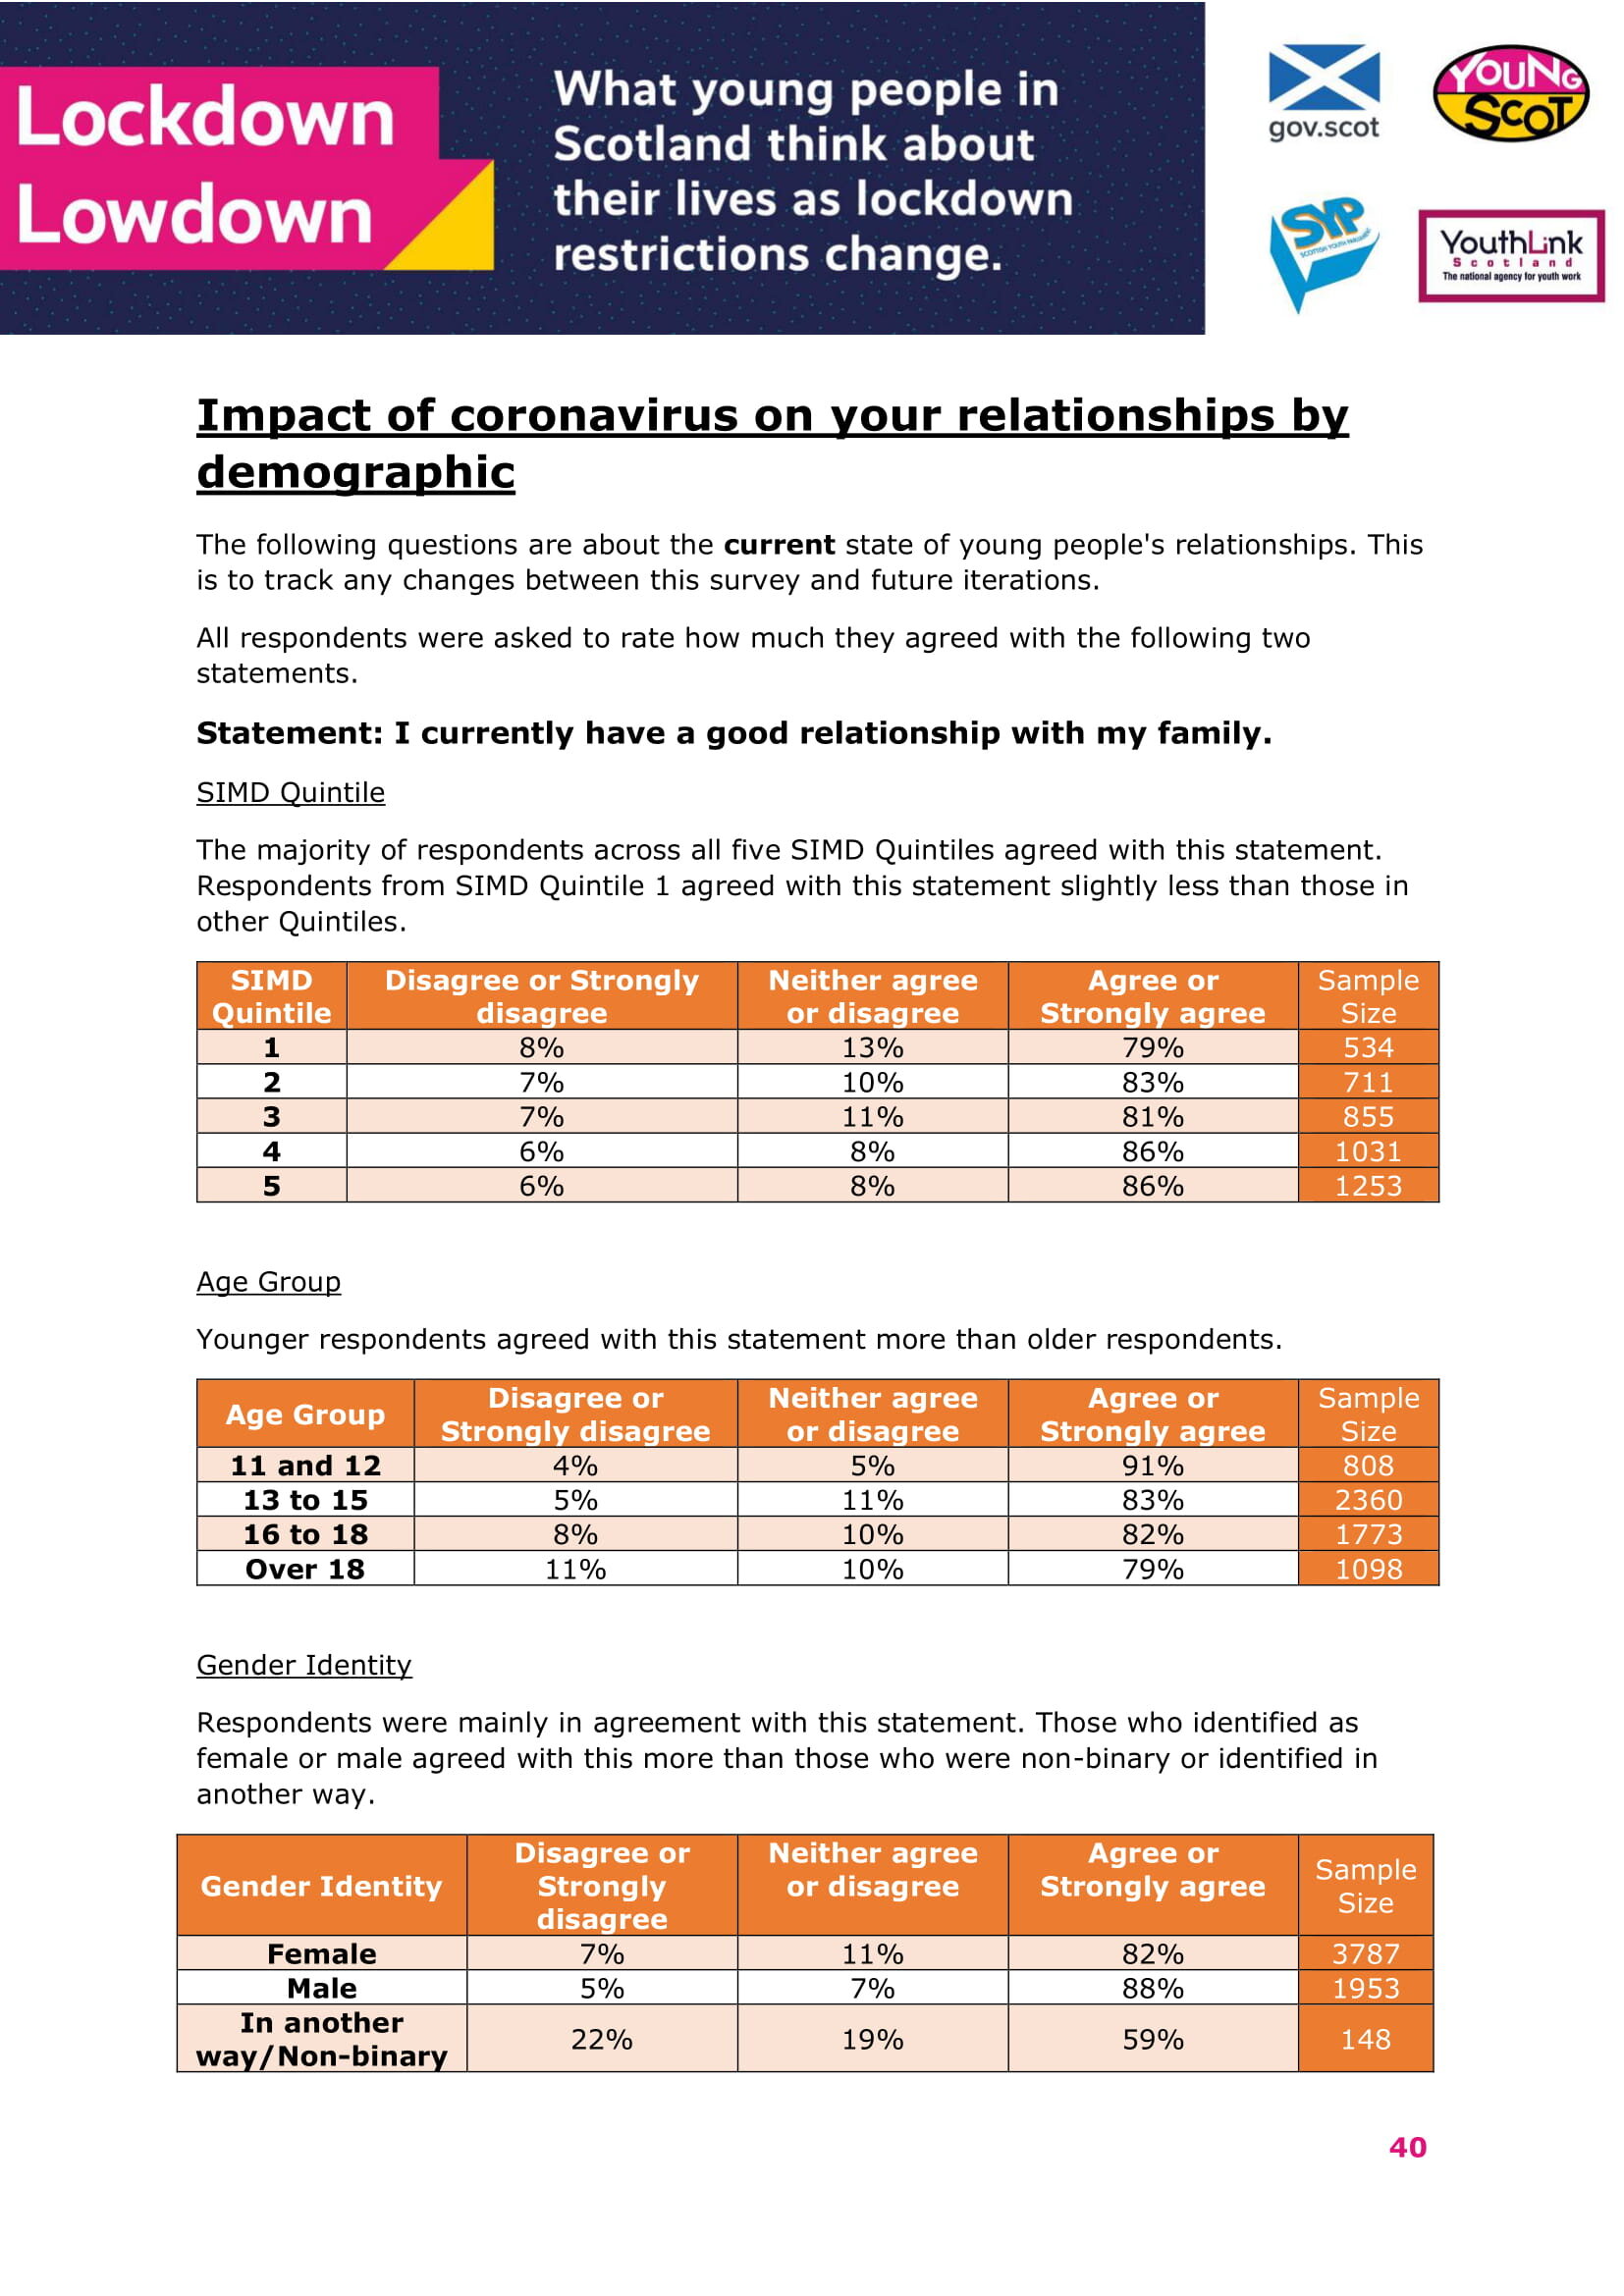
Statement: I currently have a good relationship with my family.
SIMD Quintile
The majority of respondents across all five SIMD Quintiles agreed with this statement. Respondents from SIMD Quintile 1 agreed with this statement slightly less than those in other Quintiles.
SIMD Quintile Disagree or Strongly disagree Neither agree or disagree Agree or Strongly agree Sample Size
1 8% 13% 79% 534
2 7% 10% 83% 711
3 7% 11% 81% 855
4 6% 8% 86% 1031
5 6% 8% 86% 1253
Age Group
Younger respondents agreed with this statement more than older respondents.
Age Group Disagree or Strongly disagree Neither agree or disagree Agree or Strongly agree Sample Size
11 and 12 4% 5% 91% 808
13 to 15 5% 11% 83% 2360
16 to 18 8% 10% 82% 1773
Over 18 11% 10% 79% 1098
Gender Identity
Respondents were mainly in agreement with this statement. Those who identified as female or male agreed with this more than those who were non-binary or identified in another way.
Gender Identity Disagree or Strongly disagree Neither agree or disagree Agree or Strongly agree Sample Size
Female 7% 11% 82% 3787
Male 5% 7% 88% 1953
In another way/Non-binary 22% 19% 59% 148
Long-term Illness or Disability
The majority of both groups agreed with this statement. Respondents with a long-term illness or disability agreed with this statement less than those who did not.
Long-term illness or disability Disagree or Strongly disagree Neither agree or disagree Agree or Strongly agree Sample Size
Long-term illness or disability 13% 13% 74% 599
No long-term illness or disability 6% 9% 85% 5085
Young Carers
The majority of both groups agreed with this statement. Young carers agreed with this statement less than respondents who were not a young carer.
Young carer? Disagree or Strongly disagree Neither agree or disagree Agree or Strongly agree Sample Size
Young carers 12% 14% 74% 352
Not a young carer 7% 10% 84% 5690
Care Experienced
The majority of both groups agreed with this statement. Respondents who were care experienced agreed with this statement less than the other group.
Care experienced? Disagree or Strongly disagree Neither agree or disagree Agree or Strongly agree Sample Size
Care experienced 15% 14% 71% 307
Not care experienced 7% 10% 84% 5735
Ethnic Group
The majority of respondents across all groups agreed with this statement. BAME respondents agreed with this statement less than White respondents.
Ethnic Group Disagree or Strongly disagree Neither agree or disagree Agree or Strongly agree Sample Size
White 7% 10% 84% 5493
BAME 11% 12% 77% 334
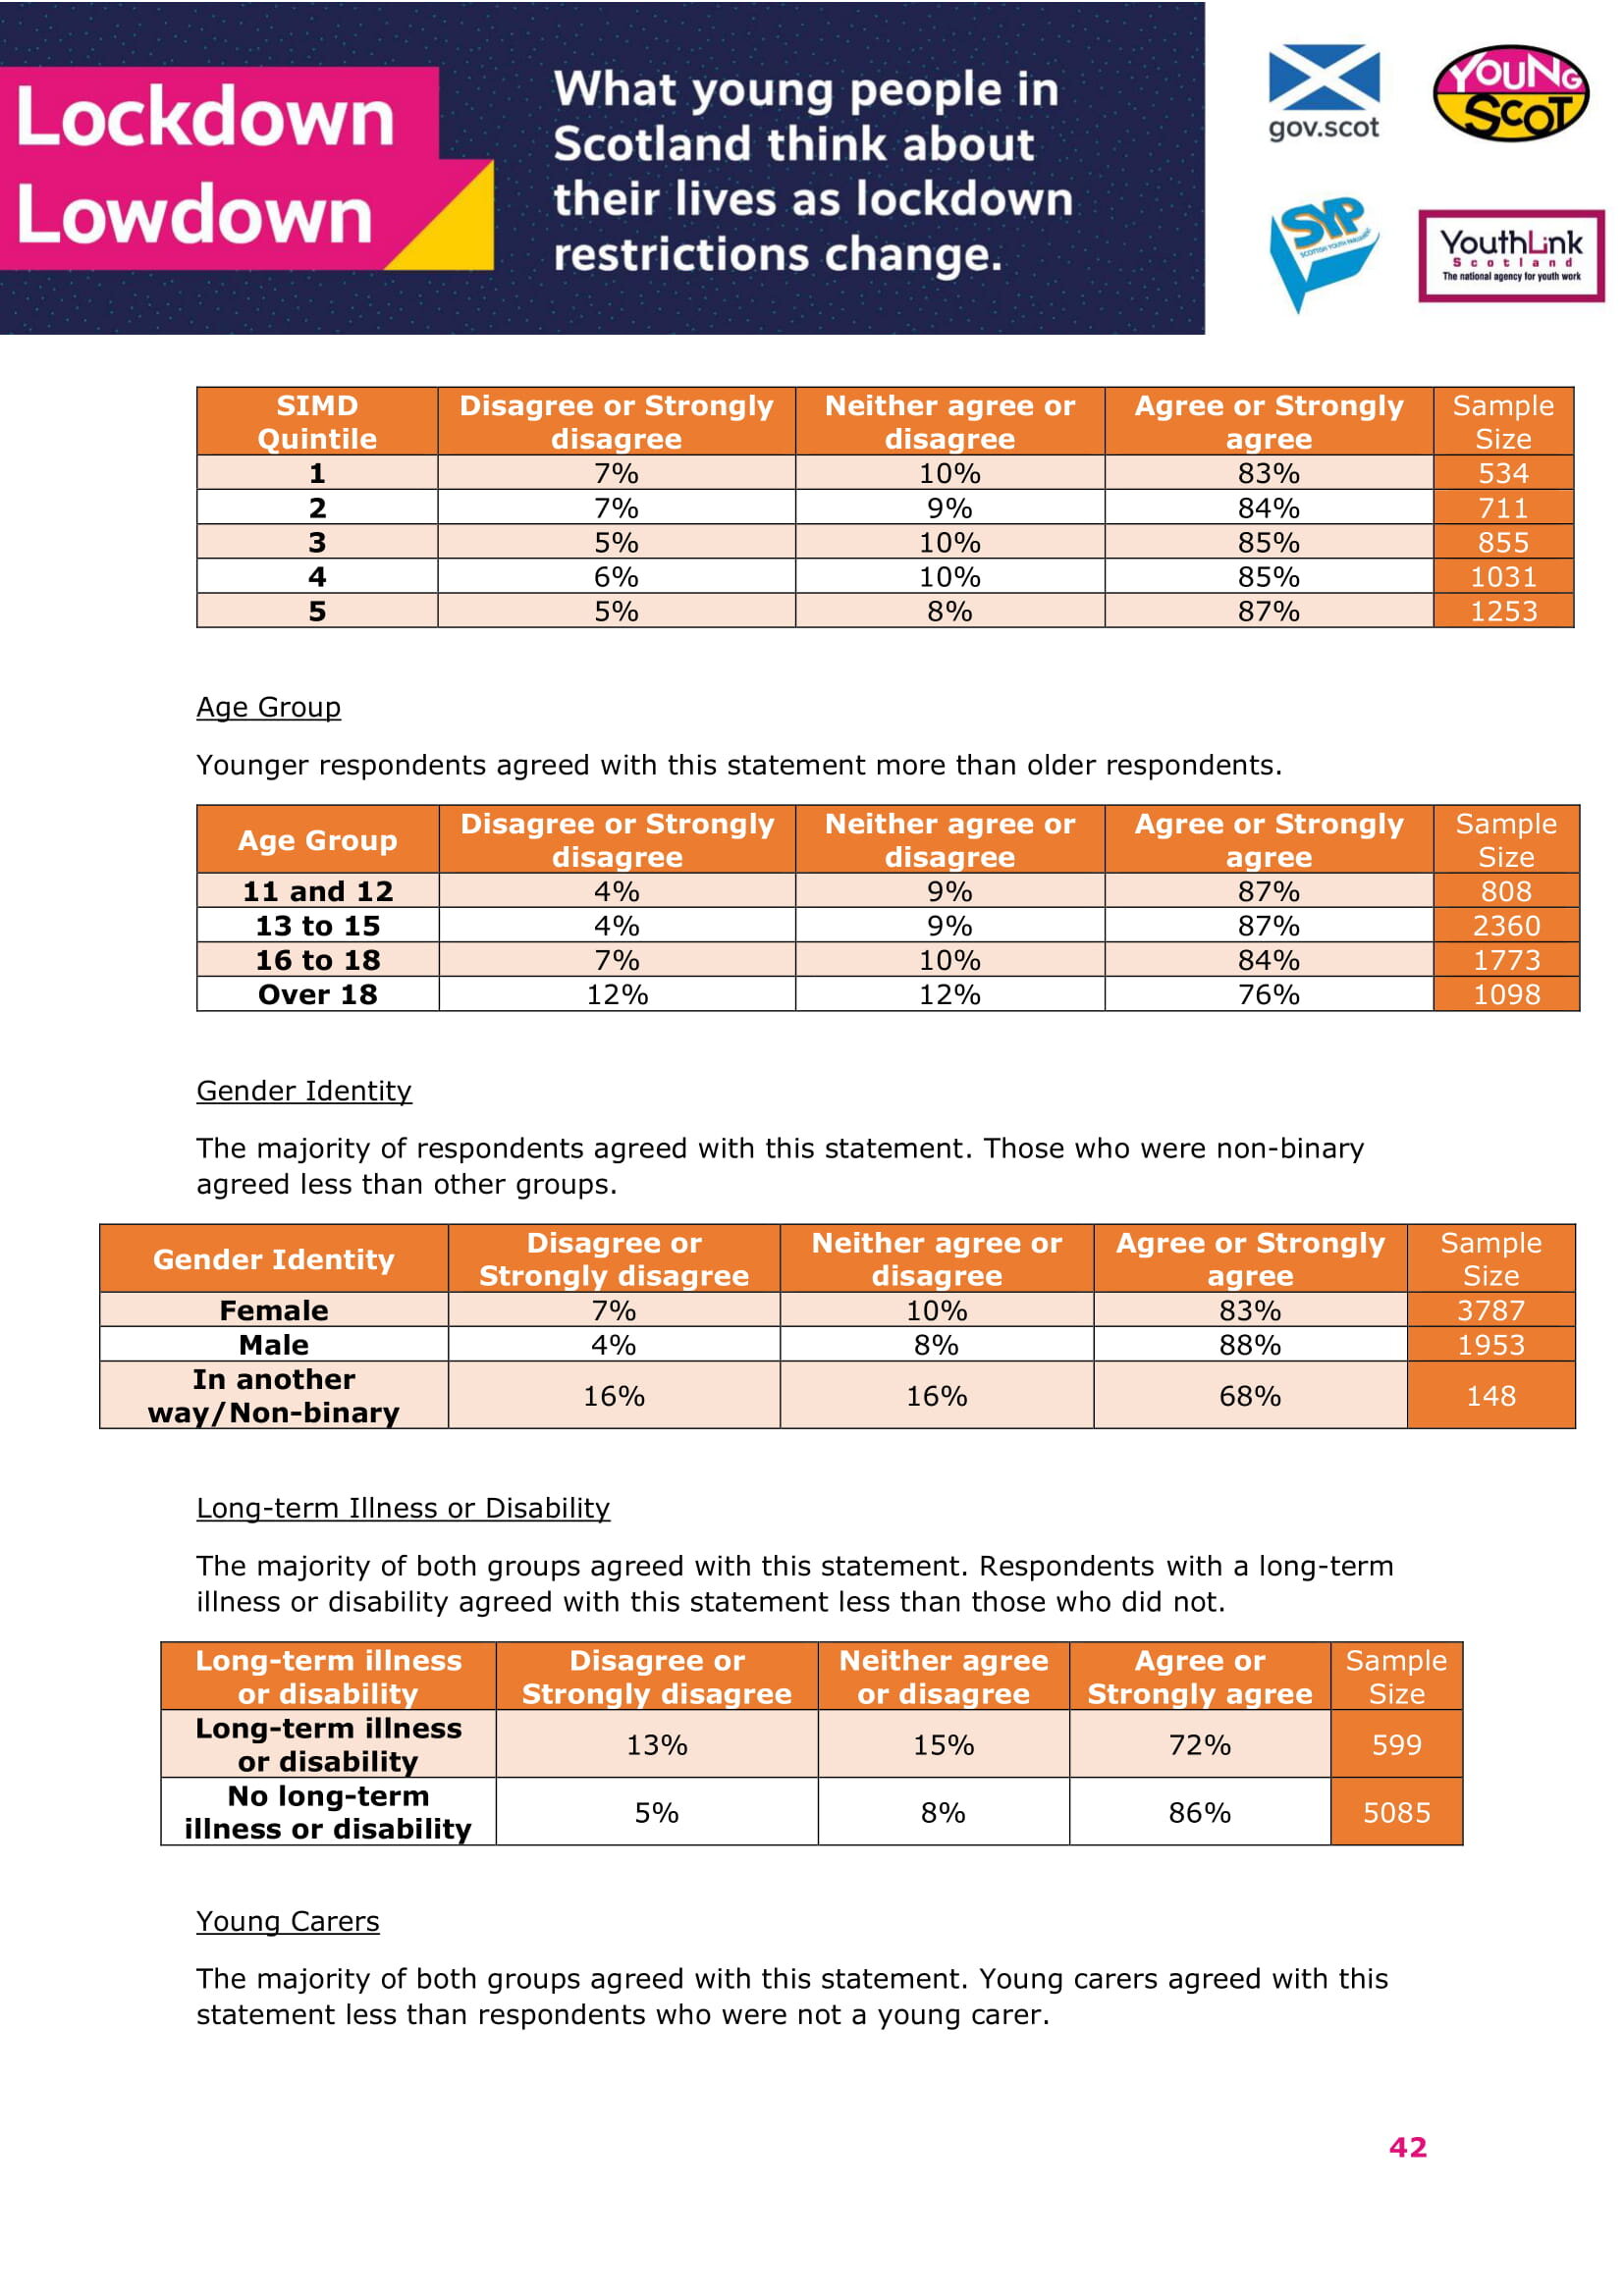
Statement: I currently have a good relationship with my friends.
SIMD Quintile
The majority of respondents across all five SIMD Quintiles agreed with this statement.
SIMD Quintile Disagree or Strongly disagree Neither agree or disagree Agree or Strongly agree Sample Size
1 7% 10% 83% 534
2 7% 9% 84% 711
3 5% 10% 85% 855
4 6% 10% 85% 1031
5 5% 8% 87% 1253
Age Group
Younger respondents agreed with this statement more than older respondents.
Age Group Disagree or Strongly disagree Neither agree or disagree Agree or Strongly agree Sample Size
11 and 12 4% 9% 87% 808
13 to 15 4% 9% 87% 2360
16 to 18 7% 10% 84% 1773
Over 18 12% 12% 76% 1098
Gender Identity
The majority of respondents agreed with this statement. Those who were non-binary agreed less than other groups.
Gender Identity Disagree or Strongly disagree Neither agree or disagree Agree or Strongly agree Sample Size
Female 7% 10% 83% 3787
Male 4% 8% 88% 1953
In another way/Non-binary 16% 16% 68% 148
Long-term Illness or Disability
The majority of both groups agreed with this statement. Respondents with a long-term illness or disability agreed with this statement less than those who did not.
Long-term illness or disability Disagree or Strongly disagree Neither agree or disagree Agree or Strongly agree Sample Size
Long-term illness or disability 13% 15% 72% 599
No long-term illness or disability 5% 8% 86% 5085
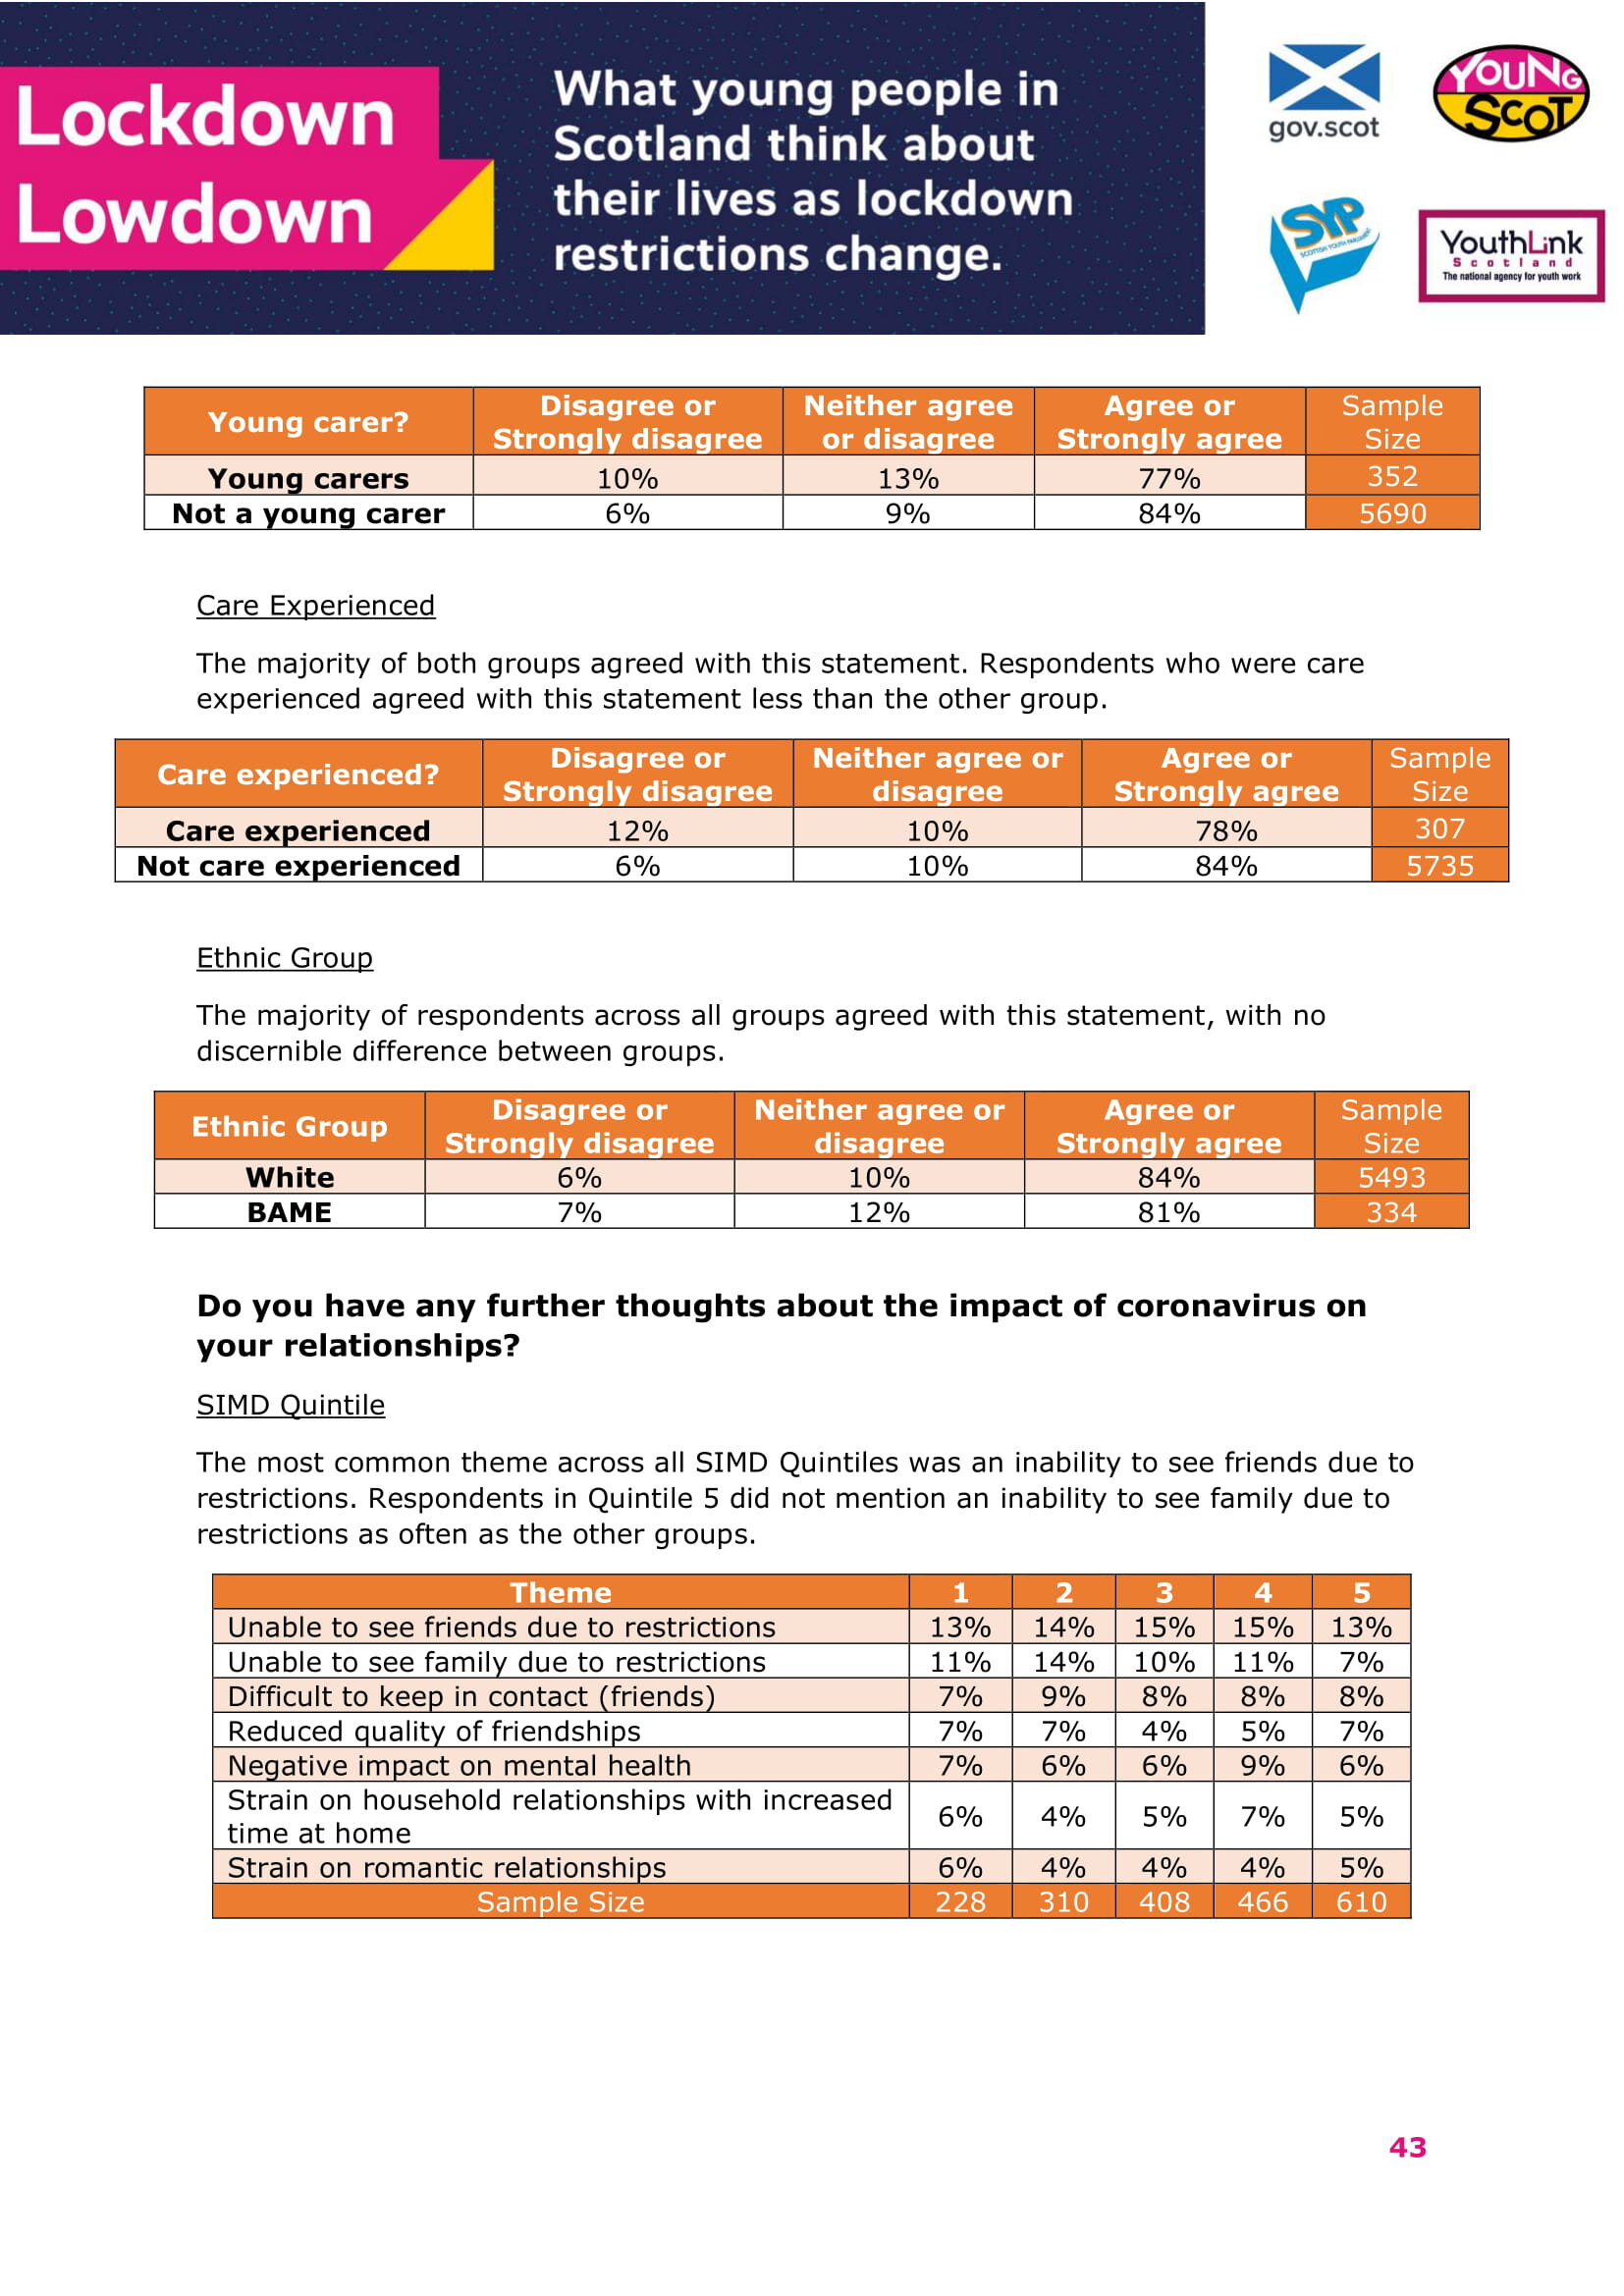
Young Carers
The majority of both groups agreed with this statement. Young carers agreed with this statement less than respondents who were not a young carer.
Young carer? Disagree or Strongly disagree Neither agree or disagree Agree or Strongly agree Sample Size
Young carers 10% 13% 77% 352
Not a young carer 6% 9% 84% 5690
Care Experienced
The majority of both groups agreed with this statement. Respondents who were care experienced agreed with this statement less than the other group.
Care experienced? Disagree or Strongly disagree Neither agree or disagree Agree or Strongly agree Sample Size
Care experienced 12% 10% 78% 307
Not care experienced 6% 10% 84% 5735
Ethnic Group
The majority of respondents across all groups agreed with this statement, with no discernible difference between groups.
Ethnic Group Disagree or Strongly disagree Neither agree or disagree Agree or Strongly agree Sample Size
White 6% 10% 84% 5493
BAME 7% 12% 81% 334
Do you have any further thoughts about the impact of coronavirus on your relationships?
SIMD Quintile
The most common theme across all SIMD Quintiles was an inability to see friends due to restrictions. Respondents in Quintile 5 did not mention an inability to see family due to restrictions as often as the other groups.
Theme 1 2 3 4 5
Unable to see friends due to restrictions 13% 14% 15% 15% 13%
Unable to see family due to restrictions 11% 14% 10% 11% 7%
Difficult to keep in contact (friends) 7% 9% 8% 8% 8%
Reduced quality of friendships 7% 7% 4% 5% 7%
Negative impact on mental health 7% 6% 6% 9% 6%
Strain on household relationships with increased time at home 6% 4% 5% 7% 5%
Strain on romantic relationships 6% 4% 4% 4% 5%
Sample Size 228 310 408 466 610
Age Group
The most common theme from responses across all age groups was an inability to see friends due to restrictions.
Respondents over the age of 18 mentioned an inability to see family more than other age groups.
Respondents over the age of 16 mentioned some themes more often than those aged 11 to 15. They mentioned difficulties in keeping contact with friends and reduced qualities of friendships more than the younger groups. They also reported a negative impact on mental health and feeling isolated or lonely. This age group reported strains on household and romantic relationships more than others. There were also more mentions of technology not being the same as socialising in person than in younger groups.
Theme 11 and 12 13 to 15 16 to 18 Over 18
Unable to see friends due to restrictions 11% 9% 14% 20%
Unable to see family due to restrictions 8% 7% 7% 17%
Difficult to keep in contact (friends) 4% 5% 11% 11%
Negative impact on mental health 1% 3% 10% 14%
Reduced quality of friendships 3% 4% 8% 8%
Strain on household relationships with increased time at home 2% 4% 7% 8%
Improved quality of family relationship 2% 4% 6% 4%
Strain on romantic relationships 0% 1% 7% 9%
Feeling isolated or lonely 0% 2% 4% 7%
Unable to see people (general) 4% 4% 2% 3%
Use of technology not the same as socialising in person 1% 1% 5% 7%
Sample Size 373 995 681 628
Gender Identity
There were not enough responses from those who identified as non-binary or in another way so this group has been removed for this question.
The most common theme from responses across both groups was an inability to see friends due to restrictions. Female respondents mentioned all of the topics more than male respondents.
Theme Female Male
Unable to see friends due to restrictions 15% 11%
Unable to see family due to restrictions 11% 6%
Difficult to keep in contact (friends) 9% 5%
Negative impact on mental health 9% 4%
Reduced quality of friendships 8% 3%
Strain on household relationships with increased time at home 7% 2%
Improved quality of family relationship 5% 3%
Strain on romantic relationships 5% 3%
Feeling isolated or lonely 5% 1%
Use of technology not the same as socialising in person 4% 2%
Sample Size 1677 850
Long-term Illness or Disability
The most common theme from responses across both groups was an inability to see friends due to restrictions.
Those with a long-term illness or disability discussed a negative impact on their mental health and feelings of isolation or loneliness more than those who did not.
Respondents who did not have a long-term illness or disability mentioned a reduction in quality of their friendships slightly more than the other group.
Theme Long-term illness or disability No long-term illness or disability
Unable to see friends due to restrictions 15% 13%
Unable to see family due to restrictions 10% 9%
Difficult to keep in contact (friends) 8% 8%
Negative impact on mental health 12% 7%
Reduced quality of friendships 2% 6%
Strain on household relationships with increased time at home 6% 5%
Improved quality of family relationship 4% 4%
Strain on romantic relationships 4% 4%
Feeling isolated or lonely 7% 3%
Unable to see people (general) 4% 3%
Use of technology not the same as socialising in person 6% 3%
Sample Size 319 2185
Young Carers
The top theme for both groups was an inability to see friends due to restrictions. Responses were similar across both groups.
Theme Young carers Not a young carer
Unable to see friends due to restrictions 13% 13%
Unable to see family due to restrictions 10% 9%
Difficult to keep in contact (friends) 9% 8%
Negative impact on mental health 10% 7%
Reduced quality of friendships 8% 6%
Strain on household relationships with increased time at home 5% 5%
Improved quality of family relationship 4% 4%
Strain on romantic relationships 5% 4%
Feeling isolated or lonely 4% 3%
Unable to see people (general) 2% 3%
Sample Size 171 2508
Care Experienced
The top theme for respondents who were care experienced was an inability to see family due to restrictions. The top theme for those who were not care experienced was an inability to see friends due to restrictions.
Theme Care experienced Not care experienced
Unable to see friends due to restrictions 9% 13%
Unable to see family due to restrictions 12% 9%
Difficult to keep in contact (friends) 6% 8%
Negative impact on mental health 7% 7%
Reduced quality of friendships 7% 6%
Strain on household relationships with increased time at home 2% 5%
Improved quality of family relationship 4% 4%
Strain on romantic relationships 5% 4%
Feeling isolated or lonely 4% 3%
Unable to see people (general) 4% 3%
Use of technology not the same as socialising in person 3% 3%
Improved quality of friendships 2% 3%
Reduced quality of family relationships 6% 3%
Sample Size 163 2516
Ethnic Group
The top theme for both ethnic groups was an inability to see friends due to restrictions, with BAME respondents mentioning this more than White respondents.
Theme White BAME
Unable to see friends due to restrictions 13% 21%
Unable to see family due to restrictions 10% 9%
Difficult to keep in contact (friends) 8% 5%
Negative impact on mental health 7% 5%
Reduced quality of friendships 6% 5%
Strain on household relationships with increased time at home 5% 5%
Improved quality of family relationship 4% 3%
Strain on romantic relationships 4% 1%
Feeling isolated or lonely 3% 3%
Unable to see people (general) 3% 4%
Sample Size 2423 143
Impact of coronavirus on employment by demographic
The following questions were answered by 1,016 young people who stated that they were in either part-time or full-time employment.
Respondents were asked to rate how much they agreed with the following statement.
Statement: I feel good about my current employment situation.
SIMD Quintile
Results for this question were mixed, with respondents in SIMD Quintiles 1 and 4 agreeing with this statement more than those in other Quintiles. The strongest levels of disagreement were from respondents in SIMD Quintile 2.
SIMD Quintile Disagree or Strongly disagree Neither agree or disagree Agree or Strongly agree Sample Size
1 20% 18% 62% 100
2 33% 12% 55% 125
3 27% 18% 55% 171
4 25% 15% 61% 204
5 27% 18% 55% 166
Age Group
There were not enough responses from those in the 11 and 12 and 13 to 15 age groups for this question so these groups have been removed.
A third of respondents over the age of 18 disagreed with this statement.
Age Group Disagree or Strongly disagree Neither agree or disagree Agree or Strongly agree Sample Size
16 to 18 26% 19% 55% 319
Over 18 33% 14% 53% 607
Gender Identity
There were not enough responses from those in the non-binary and “in another way” group for this question so it has been removed.
Levels of agreement were similar between female and male respondents, with no discernible pattern.
Gender Identity Disagree or Strongly disagree Neither agree or disagree Agree or Strongly agree Sample Size
Female 30% 16% 54% 741
Male 24% 16% 59% 233
Long-term Illness or Disability
The majority of both groups agreed with this statement. Respondents with a long-term illness or disability agreed with this statement less than those who did not.
Long-term illness or disability Disagree or Strongly disagree Neither agree or disagree Agree or Strongly agree Sample Size
Long-term illness or disability 36% 15% 49% 125
No long-term illness or disability 28% 16% 57% 840
Young Carers
There were not enough responses to this question from respondents who identified as being a young carer. Therefore, no comparison will be done for this question.
Care Experienced
There were not enough responses to this question from respondents who identified as being care experienced. Therefore, no comparison will be done for this question.
Ethnic Group
There were not enough responses to this question from respondents who identified as BAME. Therefore, no comparison will be done for this question.
Employment Status
Both groups mainly agreed with this statement. Respondents in full-time employment agreed with this slightly more than those in part-time employment.
Employment Status Disagree or Strongly disagree Neither agree or disagree Agree or Strongly agree Sample Size
Employment (full-time) 29% 11% 60% 342
Employment (part-time) 29% 18% 53% 674
Have any of the following happened to you as a result of coronavirus?
SIMD Quintile
The most common consequence of coronavirus on employment across all SIMD Quintiles was an alteration in working conditions. All consequences were of similar levels across the groups.
SIMD Quintile Furlough Alter working conditions Reduction of hours Loss of job Sample Size
1 11% 22% 11% 5% 534
2 10% 22% 11% 5% 711
3 11% 25% 13% 6% 855
4 12% 23% 10% 6% 1031
5 8% 27% 9% 6% 1253
Age Group
The level of applicable responses from those aged 11 and 12 was very small so this age group has been removed.
The most common consequence of coronavirus on employment across all age groups was an alteration in working conditions. Consequences were more common for those over 18.
The relatively large amount of school age respondents who selected Alter working conditions compared to the other consequences suggests that this could have been interpreted as schoolwork rather than employment. This is something to bear in mind for future iterations of the survey.
Age Group Furlough Alter working conditions Reduction of hours Loss of job Sample Size
13 to 15 2% 25% 4% 2% 2358
16 to 18 13% 18% 13% 7% 1773
Over 18 29% 37% 24% 15% 1098
Gender Identity
The most common consequence of coronavirus on employment across all groups was an alteration in working conditions.
Gender Identity Furlough Alter working conditions Reduction of hours Loss of job Sample Size
Female 12% 26% 12% 6% 3787
Male 7% 21% 8% 4% 1951
In another way/Non-binary 13% 28% 12% 10% 148
Long-term Illness or Disability
The most common consequence of coronavirus on employment across both groups was an alteration in working conditions. Results were similar across both groups, although those with a long-term illness or disability experienced all consequences slightly more than the other group.
Long-term illness or disability Furlough Alter working conditions Reduction of hours Loss of job Sample Size
Long-term illness or disability 13% 26% 15% 9% 599
No long-term illness or disability 10% 24% 10% 5% 5082
Young Carers
The most common consequence of coronavirus on employment across both groups was an alteration in working conditions. Results were similar across both groups, although young carers experienced a reduction of hours slightly more than the other group.
Young carer? Furlough Alter working conditions Reduction of hours Loss of job Sample Size
Young carers 10% 25% 15% 7% 352
Not a young carer 10% 24% 10% 6% 5688
Care Experienced
The most common consequence of coronavirus on employment across both groups was an alteration in working conditions. Care experienced respondents experienced all consequences slightly more than the other group.
Care experienced? Furlough Alter working conditions Reduction of hours Loss of job Sample Size
Care experienced 11% 29% 16% 11% 306
Not care experienced 10% 24% 10% 5% 5734
Ethnic Group
The most common consequence of coronavirus on employment across both groups was an alteration in working conditions. There were no discernible differences between groups.
Ethnic Group Furlough Alter working conditions Reduction of hours Loss of job Sample Size
White 10% 24% 11% 6% 5490
BAME 8% 22% 10% 5% 334
Employment Status
Over half of those in full-time employment had to alter working conditions. The most common consequence for respondents in part-time employment was a reduction in hours. Almost a fifth of employed respondents experienced furlough.
Employment Status Furlough Alter working conditions Reduction of hours Loss of job Sample Size
Employment (full-time) 38% 54% 22% 8% 342
Employment (part-time) 38% 26% 41% 12% 674
Respondents were asked to rate how much they agreed with the following statement.
Statement: I feel good about my future employment prospects.
SIMD Quintile
Levels of agreement were similar across all SIMD Quintiles.
SIMD Quintile Disagree or Strongly disagree Neither agree or disagree Agree or Strongly agree Sample Size
1 27% 42% 31% 534
2 26% 42% 32% 711
3 28% 39% 33% 855
4 24% 39% 37% 1030
5 25% 43% 32% 1253
Age Group
Younger respondents agreed with this statement more than older respondents. Around half of respondents over the age of 18 disagreed with this statement.
Age Group Disagree or Strongly disagree Neither agree or disagree Agree or Strongly agree Sample Size
11 and 12 6% 53% 40% 808
13 to 15 15% 48% 36% 2357
16 to 18 37% 37% 26% 1773
Over 18 51% 22% 27% 1098
Gender Identity
Male respondents agreed with this statement more than other groups. Almost half of non-binary respondents disagreed with this statement.
Gender Identity Disagree or Strongly disagree Neither agree or disagree Agree or Strongly agree Sample Size
Female 30% 41% 29% 3786
Male 20% 41% 39% 1951
In another way/
Non-binary 45% 30% 24% 148
Long-term Illness or Disability
Those who did not have a long-term illness or disability agreed with this statement more than respondents who did.
Long-term illness or disability Disagree or Strongly disagree Neither agree or disagree Agree or Strongly agree Sample Size
Long-term illness or disability 39% 35% 27% 599
No long-term illness or disability 25% 41% 33% 5081
Young Carers
Young carers agreed with this statement marginally less than respondents who were not a young carer.
Young carer? Disagree or Strongly disagree Neither agree nor disagree Agree or Strongly agree Sample Size
Young carers 32% 39% 29% 352
Not a young carer 27% 41% 32% 5687
Care Experienced
Care experienced respondents mostly agreed with this statement whereas those who were not mostly selected Neither agree or disagree. Care experienced respondents agreed with this statement slightly more than other respondents.
Care experienced? Disagree or Strongly disagree Neither agree or disagree Agree or Strongly agree Sample Size
Care experienced 29% 34% 37% 306
Not care experienced 27% 41% 32% 5733
Ethnic Group
Around a third of both groups agreed with this statement.
Ethnic Group Disagree or Strongly disagree Neither agree or disagree Agree or Strongly agree Sample Size
White 27% 41% 32% 5489
BAME 28% 41% 31% 334
Employment Status
Respondents in full-time employment agreed with this statement more than those in part-time employment.
Employment Status Disagree or Strongly disagree Neither agree or disagree Agree or Strongly agree Sample Size
Employment (full-time) 38% 18% 44% 342
Employment (part-time) 38% 28% 34% 674
Do you have any further thoughts about the impact of coronavirus on employment?
SIMD Quintile
One of the most prominent themes across all Quintiles was the negative impact of COVID on the workforce and future.
Another prominent theme for respondents in Quintile 1 was concern around others losing their jobs or finding work. The most common theme for respondents in Quintile 2 was the concern that being young is a barrier to finding or losing work. Responses were quite mixed between Quintiles, with no real pattern aligning with levels of deprivation.
Theme 1 2 3 4 5
COVID and restrictions have negatively impacted workforce and future 7% 5% 7% 8% 6%
Being young is a barrier to finding work/losing work 1% 7% 4% 6% 6%
Concerned about job security in their industry 3% 2% 5% 5% 6%
Unable to/harder to find a job 4% 6% 4% 3% 3%
Worried about finding work after education 3% 3% 4% 4% 4%
Impact of exams and less schooling on future employment 4% 3% 2% 4% 5%
Concern about others losing jobs/finding work 7% 4% 2% 3% 2%
Kept, found or increased work during COVID 4% 4% 4% 6% 2%
Sample Size 165 230 283 341 453
Age Group
Respondents aged 11 and 12 were mostly concerned about the negative impact of COVID on the workforce and future and others losing jobs or finding work. Respondents who were aged 13 to 15 were most concerned about the impact of schooling/exams on their future employment. Those aged 16 to 18 highlighted that being young felt like a barrier to finding or losing work. Respondents over 18 were mostly concerned about job security within their chosen industry.
Respondents aged 11 and 12 were the more concerned about others losing jobs or finding work than other groups. Concerns were felt most greatly in respondents over 18 around finding work after completing education, difficulties of finding a job and reduced hours. However, those over 18 had also kept, found or increased work during this time than other groups.
These results may be a reflection on the fact that those over 18 are more likely to be in full- time employment than other age groups.
Theme 11 and 12 13 to 15 16 to 18 Over 18
COVID and restrictions have negatively impacted workforce and future 4% 4% 9% 9%
Being young is a barrier to finding work/losing work 0% 3% 13% 4%
Concerned about job security in their industry 1% 1% 5% 11%
Unable to/harder to find a job 0% 1% 7% 6%
Worried about finding work after education 1% 1% 3% 10%
Impact of exams and less schooling on future employment 1% 6% 5% 0%
Concern about others losing jobs/finding work 4% 2% 3% 4%
Kept, found or increased work during COVID 0% 0% 3% 8%
Have lost job 0% 1% 3% 5%
Furlough 0% 1% 2% 5%
Working from home 0% 1% 0% 6%
Worried about losing job or reduction in hours 0% 0% 1% 6%
Sample Size 267 696 496 521
Gender Identity
There were not enough responses from those who identified as non-binary or in another way for this question so this group has been removed.
The most common theme from female respondents was the opinion that being young is a barrier to finding or losing work. The most common theme from male respondents was the negative impact of COVID on the workforce and future.
Theme Female Male
Being young is a barrier to finding work/losing work 7% 4%
COVID and restrictions have negatively impacted workforce and future 6% 7%
Concerned about job security in their industry 5% 3%
Impact of exams and less schooling on future employment 5% 2%
Worried about finding work after education 5% 3%
Unable to/harder to find a job 5% 2%
Kept, found or increased work during COVID 4% 3%
Concern about others losing jobs/finding work 3% 3%
Sample Size 1190 684
Long-term Illness or Disability
The most common theme from responses across both groups was the negative impact of COVID on the workforce and future. This was mentioned slightly more by respondents with a long-term illness or disability than by those who did not.
Respondents with a long-term illness or disability expressed concern about job security in their industry and the inability/difficulty to find a job slightly more than the other group.
Theme Long-term illness or disability No long-term illness or disability
COVID and restrictions have negatively impacted workforce and future 9% 6%
Being young is a barrier to finding work/losing work 6% 5%
Concerned about job security in their industry 8% 4%
Unable to/harder to find a job 6% 4%
Worried about finding work after education 4% 4%
Impact of exams and less schooling on future employment 3% 4%
Concern about others losing jobs/finding work 4% 3%
Kept, found or increased work during COVID 3% 3%
Have lost job 3% 2%
Furlough 2% 2%
Working from home 4% 2%
Worried about losing job or reduction in hours 3% 2%
Sample Size 233 1619
Young Carers
The most common theme from responses across both groups was the negative impact of COVID on the workforce and future. Respondents who were young carers mentioned this more than those who were not.
Theme Young carers Not a young carer
COVID and restrictions have negatively impacted workforce and future 12% 6%
Being young is a barrier to finding work/losing work 4% 5%
Concerned about job security in their industry 4% 5%
Unable to/harder to find a job 2% 4%
Worried about finding work after education 3% 4%
Impact of exams and less schooling on future employment 4% 4%
Concern about others losing jobs/finding work 6% 3%
Kept, found or increased work during COVID 2% 3%
Have lost job 3% 2%
Furlough 1% 2%
Working from home 4% 2%
Sample Size 113 1868
Care Experienced
The most common theme from responses across both groups was the negative impact of COVID on the workforce and future.
Theme Care experienced Not care experienced
COVID and restrictions have negatively impacted workforce and future 8% 7%
Being young is a barrier to finding work/losing work 3% 5%
Concerned about job security in their industry 6% 5%
Unable to/harder to find a job 4% 4%
Worried about finding work after education 2% 4%
Impact of exams and less schooling on future employment 5% 4%
Concern about others losing jobs/finding work 4% 3%
Kept, found or increased work during COVID 4% 3%
Have lost job 3% 2%
Furlough 1% 2%
Working from home 4% 2%
Worried about losing job or reduction in hours 3% 2%
Sample Size 117 1864
Ethnic Group
There were not enough responses from those in the BAME ethnic groups. Therefore, no comparison will be done for this question according to ethnic group.
Employment Status
There were not enough responses from those who stated that they were unemployed, therefore this group has been removed from comparison.
The most common themes differed between groups. For respondents in full-time employment, the top mention was working from home. For those working part-time, the most common theme was that they had kept, found or increased work during COVID. Those in part-time employment were concerned over losing their job, a reduction in their hours and stated that they had lost their job more than the other groups. This group also expressed that being young is a barrier to working slightly more than those in full-time employment.
Theme Employment
(full-time) Employment
(part-time)
Kept, found or increased work during COVID 14% 10%
Concerned about job security in their industry 10% 8%
Working from home 16% 1%
Worried about losing job or reduction in hours 5% 9%
Furlough 5% 6%
Being young is a barrier to finding work/losing work 2% 6%
COVID and restrictions have negatively impacted workforce and future 5% 5%
Worried about finding work after education 2% 5%
Concern about others losing jobs/finding work 4% 2%
Unable to/harder to find a job 0% 3%
Have lost job 2% 7%
Sample Size 157 270
Impact of coronavirus on you by demographic
The following questions are about the current state of young people’s health, wellbeing, access to their rights and concerns around coronavirus. This is to track any changes between this survey and future iterations.
Respondents were asked to rate how much they agreed with the following statements.
Statement: I feel good about my physical health and wellbeing.
SIMD Quintile
There was a disparity in responses based on SIMD Quintiles, with those in areas of higher deprivation disagreeing more than respondents in low deprivation areas.
SIMD Quintile Disagree or Strongly disagree Neither agree nor disagree Agree or Strongly agree Sample Size
1 29% 20% 51% 533
2 22% 22% 56% 711
3 23% 21% 56% 855
4 19% 18% 63% 1031
5 18% 16% 66% 1253
Age Group
Younger respondents agreed with this statement much more than older respondents. The percentage difference between each group was at least 12%, with a 40% difference between the youngest and oldest groups.
Age Group Disagree or Strongly disagree Neither agree or disagree Agree or Strongly agree Sample Size
11 and 12 6% 13% 82% 808
13 to 15 15% 19% 66% 2359
16 to 18 25% 22% 53% 1773
Over 18 41% 18% 41% 1098
Gender Identity
Female and male respondents were mostly in agreement with this statement, with males agreeing the most out of all groups. Respondents who identified as non-binary or in another way agreed with this statement much less than other groups.
Gender Identity Disagree or Strongly disagree Neither agree or disagree Agree or Strongly agree Sample Size
Female 25% 20% 55% 3786
Male 13% 15% 71% 1953
In another way/
Non-binary 40% 30% 30% 148
Long-term Illness or Disability
Respondents with a long-term illness or disability agreed with this statement much less than those who did not.
Long-term illness or disability Disagree or Strongly disagree Neither agree or disagree Agree or Strongly agree Sample Size
Long-term illness or disability 39% 22% 38% 598
No long-term illness or disability 19% 18% 63% 5085
Young Carers
Young carers agreed with this statement less than respondents who were not a young carer.
Young carer? Disagree or Strongly disagree Neither agree or disagree Agree or Strongly agree Sample Size
Young carers 31% 18% 51% 352
Not a young carer 21% 19% 60% 5689
Care Experienced
Respondents who were care experienced agreed with this statement less than respondents who were not.
Care experienced? Disagree or Strongly disagree Neither agree or disagree Agree or Strongly agree Sample Size
Care experienced 31% 19% 49% 306
Not care experienced 21% 19% 60% 5735
Ethnic Group
Both groups mostly agreed with this statement. BAME respondents agreed with this statement less White respondents.
Ethnic Group Disagree or Strongly disagree Neither agree or disagree Agree or Strongly agree Sample Size
White 21% 19% 60% 5492
BAME 26% 21% 52% 334
Statement: I feel good about my mental health and wellbeing.
SIMD Quintile
The results from this question were mixed. The lowest levels of agreement were from respondents in SIMD Quintile 1, with the highest level being from respondents in SIMD Quintile 2. However, the responses from the other Quintiles were similar.
SIMD Quintile Disagree or Strongly disagree Neither agree or disagree Agree or Strongly agree Sample Size
1 45% 20% 35% 533
2 37% 21% 42% 711
3 40% 20% 39% 855
4 38% 21% 41% 1031
5 33% 20% 46% 1253
Age Group
Younger respondents agreed with this statement much more than older respondents. The percentage difference between each group was at least 12%, with a 49% difference between the youngest and oldest groups.
Age Group Disagree or Strongly disagree Neither agree or disagree Agree or Strongly agree Sample Size
11 and 12 13% 18% 69% 808
13 to 15 29% 22% 49% 2359
16 to 18 46% 21% 32% 1773
Over 18 64% 16% 20% 1098
Gender Identity
Male respondents mostly agreed with this statement. Agreement levels were lower in the other groups, with the majority of those who identified as non-binary or in another way disagreeing.
Gender Identity Disagree or Strongly disagree Neither agree or disagree Agree or Strongly agree Sample Size
Female 44% 22% 34% 3786
Male 23% 18% 59% 1953
In another way/
Non-binary 68% 14% 18% 148
Long-term Illness or Disability
Respondents with a long-term illness or disability agreed with this statement much less than those who did not.
Long-term illness or disability Disagree or Strongly disagree Neither agree or disagree Agree or Strongly agree Sample Size
Long-term illness or disability 57% 17% 26% 598
No long-term illness or disability 35% 21% 44% 5085
Young Carers
Young carers agreed with this statement less than respondents who were not a young carer.
Young carer? Disagree or Strongly disagree Neither agree or disagree Agree or Strongly agree Sample Size
Young carers 49% 15% 36% 352
Not a young carer 38% 21% 42% 5689
Care Experienced
Respondents who were care experienced agreed with this statement less than respondents who were not.
Care experienced? Disagree or Strongly disagree Neither agree or disagree Agree or Strongly agree Sample Size
Care experienced 51% 16% 34% 306
Not care experienced 38% 21% 42% 5735
Ethnic Group
Around a fifth of respondents in both groups agreed with this statement.
Ethnic Group Disagree or Strongly disagree Neither agree or disagree Agree or Strongly agree Sample Size
White 39% 20% 41% 5492
BAME 35% 24% 41% 334
Statement: I feel able to access my rights as a young person.
SIMD Quintile
The results from this question were mixed. The lowest levels of agreement were from respondents in SIMD Quintile 1, with the highest level being from respondents in SIMD Quintiles 4 and 5.
SIMD Quintile Disagree or Strongly disagree Neither agree or disagree Agree or Strongly agree Sample Size
1 12% 29% 59% 533
2 11% 26% 63% 711
3 11% 26% 63% 855
4 9% 23% 67% 1031
5 10% 22% 67% 1253
Age Group
Younger respondents agreed with this statement much more than older respondents. The percentage difference between each group was at least 10%, with a 40% difference between the youngest and oldest groups.
Age Group Disagree or Strongly disagree Neither agree or disagree Agree or Strongly agree Sample Size
11 and 12 5% 15% 81% 808
13 to 15 7% 22% 71% 2359
16 to 18 11% 28% 61% 1773
Over 18 27% 33% 41% 1098
Gender Identity
The majority of respondents agreed with this statement. Male respondents agreed with this statement much more than other groups, with non-binary respondents demonstrating the lowest levels of agreement.
Gender Identity Disagree or Strongly disagree Neither agree or disagree Agree or Strongly agree Sample Size
Female 11% 27% 62% 3786
Male 10% 20% 70% 1953
In another way/
Non-binary 22% 33% 45% 148
Long-term Illness or Disability
Both groups mainly agreed with this statement. Respondents with a long-term illness or disability agreed with this statement less than those who did not.
Long-term illness or disability Disagree or Strongly disagree Neither agree or disagree Agree or Strongly agree Sample Size
Long-term illness or disability 19% 31% 50% 598
No long-term illness or disability 10% 24% 67% 5085
Young Carers
Both groups mainly agreed with this statement. Young carers agreed with this statement less than respondents who were not a young carer.
Young carer? Disagree or Strongly disagree Neither agree or disagree Agree or Strongly agree Sample Size
Young carers 18% 26% 56% 352
Not a young carer 11% 25% 64% 5689
Care Experienced
Respondents who were care experienced agreed with this statement slightly less than respondents who were not.
Care experienced? Disagree or Strongly disagree Neither agree or disagree Agree or Strongly agree Sample Size
Care experienced 17% 24% 59% 306
Not care experienced 11% 25% 64% 5735
Ethnic Group
Respondents in both groups mostly agreed with this statement.
Ethnic Group Disagree or Strongly disagree Neither agree or disagree Agree or Strongly agree Sample Size
White 11% 25% 64% 5492
BAME 10% 26% 63% 334
Statement: I am concerned that I might catch coronavirus (COVID-19).
SIMD Quintile
There was a disparity in responses based on SIMD Quintiles, with those in SIMD Quintile 1 demonstrating more concern than respondents in low deprivation areas.
SIMD Quintile Disagree or Strongly disagree Neither agree or disagree Agree or Strongly agree Sample Size
1 25% 23% 52% 533
2 25% 28% 47% 711
3 30% 22% 48% 855
4 28% 28% 44% 1031
5 31% 26% 43% 1253
Age Group
Older respondents demonstrated more concern than younger respondents. Around half of those aged 16 or over agreed with this statement.
Age Group Disagree or Strongly disagree Neither agree or disagree Agree or Strongly agree Sample Size
11 and 12 35% 33% 33% 808
13 to 15 30% 29% 41% 2359
16 to 18 26% 23% 50% 1773
Over 18 26% 19% 55% 1098
Gender Identity
Female respondents and those who identified as non-binary or in another way demonstrated similar levels of concern. Male respondents showed less agreement with this statement.
Gender Identity Disagree or Strongly disagree Neither agree or disagree Agree or Strongly agree Sample Size
Female 24% 27% 49% 3786
Male 38% 26% 36% 1953
In another way/
Non-binary 30% 19% 51% 148
Long-term Illness or Disability
Both groups mainly agreed with this statement. Respondents with a long-term illness or disability were more concerned than those who did not.
Long-term illness or disability Disagree or Strongly disagree Neither agree or disagree Agree or Strongly agree Sample Size
Long-term illness or disability 18% 20% 61% 598
No long-term illness or disability 30% 27% 43% 5085
Young Carers
Both groups mainly agreed with this statement. Young carers were more concerned than respondents who were not a young carer.
Young carer? Disagree or Strongly disagree Neither agree or disagree Agree or Strongly agree Sample Size
Young carers 25% 18% 56% 352
Not a young carer 29% 26% 44% 5689
Care Experienced
Both groups mainly agreed with this statement, with no discernible difference between groups.
Care experienced? Disagree or Strongly disagree Neither agree or disagree Agree or Strongly agree Sample Size
Care experienced 28% 25% 47% 306
Not care experienced 29% 26% 45% 5735
Ethnic Group
Respondents in both groups mostly agreed with this statement.
Ethnic Group Disagree or Strongly disagree Neither agree or disagree Agree or Strongly agree Sample Size
White 29% 26% 45% 5492
BAME 26% 26% 48% 334
Statement: I am concerned about the possibility of a second wave of coronavirus (COVID-19).
SIMD Quintile
Levels of concern were similar across all SIMD Quintiles with no discernible pattern.
SIMD Quintile Disagree or Strongly disagree Neither agree or disagree Agree or Strongly agree Sample Size
1 12% 14% 74% 533
2 11% 16% 73% 711
3 13% 16% 72% 855
4 11% 16% 74% 1031
5 12% 17% 71% 1253
Age Group
Older respondents demonstrated more concern than younger respondents. Over three quarters of those aged 16 or over agreed with this statement.
Age Group Disagree or Strongly disagree Neither agree or disagree Agree or Strongly agree Sample Size
11 and 12 13% 27% 59% 808
13 to 15 13% 20% 67% 2359
16 to 18 11% 10% 79% 1773
Over 18 14% 10% 76% 1098
Gender Identity
Female respondents demonstrated more concern than other groups.
Gender Identity Disagree or Strongly disagree Neither agree or disagree Agree or Strongly agree Sample Size
Female 9% 14% 76% 3786
Male 19% 20% 61% 1953
In another way/
Non-binary 20% 13% 67% 148
Long-term illness or disability
The majority of both groups agreed with this statement. Respondents with a long-term illness or disability were more concerned than those who did not.
Long-term illness or disability Disagree or Strongly disagree Neither agree or disagree Agree or Strongly agree Sample Size
Long-term illness or disability 11% 11% 78% 598
No long-term illness or disability 13% 17% 70% 5085
Young carers
The majority of both groups agreed with this statement. Young carers were more concerned than respondents who were not a young carer.
Young carer? Disagree or Strongly disagree Neither agree or disagree Agree or Strongly agree Sample Size
Young carers 11% 13% 76% 352
Not a young carer 13% 17% 70% 5689
Care experienced
Both groups mainly agreed with this statement, with no discernible difference between groups.
Care experienced? Disagree or Strongly disagree Neither agree or disagree Agree or Strongly agree Sample Size
Care experienced 14% 17% 69% 306
Not care experienced 13% 16% 71% 5735
Ethnic Group
The majority of respondents in both groups agreed with this statement.
Ethnic Group Disagree or Strongly disagree Neither agree or disagree Agree or Strongly agree Sample Size
White 13% 16% 71% 5492
BAME 13% 17% 70% 334
Statement: I am concerned about transmitting coronavirus (COVID-19) to others.
SIMD Quintile
Levels of concern were similar across all SIMD Quintiles with no discernible pattern.
SIMD Quintile Disagree or Strongly disagree Neither agree nor disagree Agree or Strongly agree Sample Size
1 15% 20% 65% 533
2 14% 21% 66% 711
3 15% 21% 64% 855
4 14% 17% 69% 1031
5 16% 20% 64% 1253
Age Group
Older respondents demonstrated more concern than younger respondents. Around three quarters of those aged 16 or over agreed with this statement.
Age Group Disagree or Strongly disagree Neither agree or disagree Agree or Strongly agree Sample Size
11 and 12 19% 29% 52% 808
13 to 15 16% 26% 58% 2359
16 to 18 13% 15% 73% 1773
Over 18 15% 10% 75% 1098
Gender Identity
Female respondents demonstrated more concern than other groups.
Gender Identity Disagree or Strongly disagree Neither agree or disagree Agree or Strongly agree Sample Size
Female 12% 19% 69% 3786
Male 20% 23% 56% 1953
In another way/
Non-binary 26% 15% 59% 148
Long-term illness or disability
The majority of both groups agreed with this statement. Results were similar across both groups.
Long-term illness or disability Disagree or Strongly disagree Neither agree or disagree Agree or Strongly agree Sample Size
Long-term illness or disability 15% 17% 68% 598
No long-term illness or disability 15% 20% 65% 5085
Young carers
The majority of both groups agreed with this statement. Responses were similar across both groups with no discernible difference.
Young carer? Disagree or Strongly disagree Neither agree or disagree Agree or Strongly agree Sample Size
Young carers 16% 18% 66% 352
Not a young carer 15% 20% 65% 5689
Care experienced
Respondents who were care experienced agreed with this statement less than respondents who were not.
Care experienced? Disagree or Strongly disagree Neither agree or disagree Agree or Strongly agree Sample Size
Care experienced 20% 23% 58% 306
Not care experienced 15% 20% 65% 5735
Ethnic Group
Respondents in both groups mostly agreed with this statement. BAME respondents agreed less than White respondents.
Ethnic Group Disagree or Strongly disagree Neither agree or disagree Agree or Strongly agree Sample Size
White 15% 20% 66% 5492
BAME 17% 26% 57% 334
Do you have any further thoughts about the issues explored in this section?
The themes in this section were split in in the original report into the categories below. For the purpose of space in this report, the following abbreviations have been used:
- CV: COVID-19 general themes
- MH: Mental health
- PH: Physical health
- R: Rights
SIMD Quintile
The most common theme across all Quintiles was the fear of transmitting the virus to others. Although there are some differences between groups, these are marginal at only a few percentage points each.
Theme 1 2 3 4 5
CV - Scared of transmitting to other people 12% 14% 12% 15% 16%
MH - Decline during coronavirus outbreak 7% 5% 8% 10% 7%
CV - Worried about vulnerable family members 8% 5% 5% 8% 5%
CV - School does not feel like a safe place 7% 7% 7% 4% 4%
CV - Not personally scared of contracting the virus 2% 5% 5% 5% 5%
CV - Criticism of government 3% 3% 3% 3% 4%
MH - Worried about impact of another lockdown 1% 2% 3% 6% 2%
CV - People are not taking the guidance seriously 4% 2% 3% 4% 3%
CV - Scared of personally catching the virus 6% 3% 1% 4% 1%
Sample Size 113 196 224 279 371
Age Group
The most common theme across all age groups was the fear of transmitting the virus to others. Older respondents mentioned this much more than younger.
Respondents aged 16 to 18 mentioned that schools do not seem safe more than other groups. Respondents aged 16 or over said that they were not personally scared of catching the virus and offered more criticism of the government more than other groups. Respondents aged over 18 mentioned a decline in mental health and the fact the people were not taking the virus seriously more than the other groups.
Theme 11 and 12 13 to 15 16 to 18 Over 18
CV - Scared of transmitting to other people 6% 8% 22% 21%
MH - Decline during coronavirus outbreak 2% 3% 9% 18%
CV - Worried about vulnerable family members 4% 4% 8% 7%
CV - School does not feel like a safe place 3% 6% 11% 1%
CV - Not personally scared of contracting the virus 0% 2% 8% 9%
CV - Criticism of government 0% 1% 5% 9%
MH - Worried about impact of another lockdown 1% 2% 4% 5%
CV - People are not taking the guidance seriously 1% 1% 2% 7%
CV - Scared of personally catching the virus 2% 2% 2% 4%
CV - Second wave is inevitable 1% 2% 4% 3%
Sample Size 249 645 369 368
Gender Identity
There were not enough responses from those who identified as non-binary or in another way for this question so this group has been removed.
The most common theme across both groups was the fear of transmitting the virus to others. This was mentioned by more female respondents than male. Female respondents mentioned a concern over their mental health declining during this time more than male respondents.
Theme Female Male
CV - Scared of transmitting to other people 17% 9%
MH - Decline during coronavirus outbreak 11% 3%
CV - Worried about vulnerable family members 7% 4%
CV - School does not feel like a safe place 6% 4%
CV - Not personally scared of contracting the virus 5% 5%
CV - Criticism of government 3% 5%
MH - Worried about impact of another lockdown 4% 2%
CV - People are not taking the guidance seriously 4% 2%
Sample Size 940 594
Long-term Illness or Disability
The most common theme from respondents with a long-term illness or disability was a decline in mental health during this time. The most common theme from respondents with no long-term illness or disability was the fear of transmitting the virus to others (this was the second most common theme for the other group).
Respondents with a long-term illness or disability mentioned decreased access to mental health support more than the other group. Respondents with no long-term illness or disability stated that they were not scared of contracting the virus slightly more than those who did.
Theme Long-term illness or disability No long-term illness or disability
CV - Scared of transmitting to other people 11% 15%
MH - Decline during coronavirus outbreak 13% 7%
CV - Worried about vulnerable family members 7% 6%
CV - School does not feel like a safe place 5% 5%
CV - Not personally scared of contracting the virus 2% 6%
CV - Criticism of government 4% 3%
MH - Worried about impact of another lockdown 3% 3%
CV - People are not taking the guidance seriously 3% 3%
CV - Scared of personally catching the virus 5% 2%
CV - Second wave is inevitable 1% 2%
MH - Decreased access to support 7% 1%
Sample Size 204 1313
Young Carers
The most common theme across both groups was the fear of transmitting the virus to others. Respondents who were young carers mentioned that school did not feel like a safe place slightly more than those who were not young carers.
Theme Young carers Not a young carer
CV - Scared of transmitting to other people 14% 14%
MH - Decline during coronavirus outbreak 7% 8%
CV - Worried about vulnerable family members 8% 5%
CV - School does not feel like a safe place 9% 5%
CV - Not personally scared of contracting the virus 2% 5%
CV - Criticism of government 2% 4%
MH - Worried about impact of another lockdown 5% 3%
CV - People are not taking the guidance seriously 3% 3%
CV - Scared of personally catching the virus 3% 2%
CV - Second wave is inevitable 1% 2%
MH - Decreased access to support 5% 2%
Sample Size 105 1528
Care Experienced
There were not enough responses from respondents who stated that they were care experienced. Therefore, no comparison will be done for this question.
Ethnic Group
There were not enough responses from those in the BAME ethnic groups. Therefore, no comparison will be done for this question according to ethnic group.
Access to information by demographic
The following questions were around the types of information that young people are accessing around coronavirus and their knowledge of current restrictions. It is worth noting that the survey was live for six weeks, with various restrictions coming in to play during this time.
If you wanted to access information about the topics below during the coronavirus (COVID-19) outbreak, do you know how to do that?
SIMD Quintile
The topic that young people felt most confident in accessing information about were Information and updates. The topic that young people felt least confident accessing information about was Financial support that may be available to you.
Results were similar across all groups.
SIMD Quintile 1 2 3 4 5
Information and updates about the current coronavirus (COVID-19) restrictions 87% 87% 88% 88% 87%
Advice about the current coronavirus (COVID-19) restrictions 83% 83% 85% 85% 83%
How to help others during this time 67% 61% 67% 65% 67%
Support for mental health and wellbeing 54% 55% 58% 53% 60%
Support for physical health and wellbeing 53% 52% 55% 53% 60%
Financial support that may be available to you 37% 34% 38% 32% 32%
Sample Size 534 711 855 1031 1253
Age Group
The topic that young people felt most confident in accessing information about were Information and updates. The topic that young people felt least confident accessing information about was Financial support that may be available to you.
Older respondents felt slightly more confident in accessing information and updates about restrictions than younger respondents. Younger respondents were more confident in accessing information about how to help others and support for mental and physical wellbeing than older respondents.
Age Group 11 and 12 13 to 15 16 to 18 Over 18
Information and updates about the current coronavirus (COVID-19) restrictions 83% 86% 88% 91%
Advice about the current coronavirus (COVID-19) restrictions 81% 83% 83% 84%
How to help others during this time 80% 70% 59% 50%
Support for mental health and wellbeing 69% 61% 49% 43%
Support for physical health and wellbeing 72% 62% 46% 37%
Financial support that may be available to you 38% 36% 31% 29%
Sample Size 808 2360 1773 1098
Gender Identity
The topic that young people felt most confident in accessing information about were Information and updates. The topic that young people felt least confident accessing information about was Financial support that may be available to you.
Respondents who identified as non-binary or in another way stated that they
Gender Identity Female Male In another way/
Non-binary
Information and updates about the current coronavirus (COVID-19) restrictions 88% 87% 82%
Advice about the current coronavirus (COVID-19) restrictions 83% 83% 83%
How to help others during this time 63% 67% 65%
Support for mental health and wellbeing 53% 61% 49%
Support for physical health and wellbeing 51% 61% 50%
Financial support that may be available to you 31% 38% 35%
Sample Size 3787 1953 148
Long-term Illness or Disability
The topic that young people felt most confident in accessing information about were Information and updates. The topic that young people felt least confident accessing information about was Financial support that may be available to you.
Results were similar between the two groups.
Long-term illness or disability Long-term illness or disability No long-term illness or disability
Information and updates about the current coronavirus (COVID-19) restrictions 85% 88%
Advice about the current coronavirus (COVID-19) restrictions 82% 83%
How to help others during this time 61% 65%
Support for mental health and wellbeing 54% 57%
Support for physical health and wellbeing 51% 55%
Financial support that may be available to you 35% 34%
Sample Size 599 5085
Young Carers
The topics that young people felt most confident in accessing information about were Information and updates or Advice about the current restrictions. The topic that young people felt least confident accessing information about was Financial support that may be available to you.
Results were similar between the two groups.
Young carer? Young carers Not a young carer
Information and updates about the current coronavirus (COVID-19) restrictions 82% 87%
Advice about the current coronavirus (COVID-19) restrictions 82% 83%
How to help others during this time 68% 64%
Support for mental health and wellbeing 56% 55%
Support for physical health and wellbeing 56% 54%
Financial support that may be available to you 37% 33%
Sample Size 352 5690
Care Experienced
The topics that young people felt most confident in accessing information about were Information and updates or Advice about the current restrictions. The topic that young people felt least confident accessing information about was Financial support that may be available to you.
Results were similar between the two groups, although care experienced respondents stated that they knew how to access information around financial support more than respondents who were not care experienced.
Care experienced? Care experienced Not care experienced
Information and updates about the current coronavirus (COVID-19) restrictions 86% 87%
Advice about the current coronavirus (COVID-19) restrictions 82% 83%
How to help others during this time 69% 64%
Support for mental health and wellbeing 59% 55%
Support for physical health and wellbeing 51% 54%
Financial support that may be available to you 43% 33%
Sample Size 307 5735
Ethnic Group
The topic that young people felt most confident in accessing information about were Information and updates. The topic that young people felt least confident accessing information about was Financial support that may be available to you.
Results were similar between groups, with BAME respondents demonstrating slightly more knowledge around where to access information about financial support than White respondents.
Ethnic Group White BAME
Information and updates about the current coronavirus (COVID-19) restrictions 87% 88%
Advice about the current coronavirus (COVID-19) restrictions 83% 81%
How to help others during this time 65% 64%
Support for mental health and wellbeing 55% 57%
Support for physical health and wellbeing 54% 56%
Financial support that may be available to you 33% 39%
Sample Size 5493 334
Are there any topics not included above that you would like more information about at this time?
SIMD Quintile
There were not enough responses from respondents in SIMD Quintile 1 so this group has been removed.
The most common theme from respondents in Quintiles 2 and 4 was around accessible statistics and advice on trusted websites. The most common theme from respondents in Quintiles 3 and 5 was support for mental and physical wellbeing.
Theme 2 3 4 5
Support for own mental and physical health and wellbeing 3% 6% 4% 6%
Clear, reliable, accessible stats and advice on COVID specific issues on trusted sites 7% 3% 5% 5%
Clear information on restrictions 4% 6% 4% 5%
Education/schools 2% 4% 3% 3%
Statements about COVID and COVID response (not requests for extra info) 2% 1% 4% 2%
Sample Size 135 159 185 279
Age Group
The most common themes from respondents in almost all age groups was support for mental and physical wellbeing. The topic most mentioned by respondents aged 13 to 15 was education or schools. Respondents aged 16 and over called for clear, reliable and accessible stats and advice more than younger groups. Respondents aged over 18 mentioned clear information on restrictions more than other groups.
Theme 11 and 12 13 to 15 16 to 18 Over 18
Support for own mental and physical health and wellbeing 2% 3% 9% 16%
Clear, reliable, accessible stats and advice on COVID specific issues on trusted sites 2% 3% 7% 10%
Clear information on restrictions 1% 2% 5% 11%
Education/schools 0% 5% 7% 0%
Statements about COVID and COVID response (not requests for extra info) 1% 1% 4% 8%
Sample Size 229 541 198 143
Gender Identity
There were not enough responses from those who identified as non-binary or in another way for this question so this group has been removed.
The theme that was most common for both groups was support for mental and physical wellbeing.
Theme Female Male
Support for own mental and physical health and wellbeing 7% 3%
Clear, reliable, accessible stats and advice on COVID specific issues on trusted sites 5% 3%
Clear information on restrictions 5% 2%
Education/schools 4% 2%
Statements about COVID and COVID response (not requests for extra info) 2% 3%
Sample Size 586 449
Long-term Illness or Disability
The most common theme across both groups was support for mental and physical wellbeing. This was mentioned by respondents with a long-term illness or disability more than the other group, as well as the need for clearer and more accessible statistics and advice and financial advice and support.
Theme Long-term illness or disability No long-term illness or disability
Support for own mental and physical health and wellbeing 11% 4%
Clear, reliable, accessible stats and advice on COVID specific issues on trusted sites 8% 3%
Clear information on restrictions 4% 4%
Education/schools 5% 3%
Statements about COVID and COVID response (not requests for extra info) 2% 2%
Financial advice and support 5% 1%
Sample Size 118 909
Young Carers
There were not enough responses from young carers to this question so this comparison has not been reported.
Care Experienced
There were not enough responses from care experienced young people to this question so this comparison has not been reported.
Ethnic Group
There were not enough responses from those in the BAME ethnic groups. Therefore, no comparison will be done for this question according to ethnic group.
Which of the following statements best describes your knowledge of current COVID-19 restrictions, such as how many households you can meet, social distancing rules or requirements to wear masks?
SIMD Quintile
Most respondents across all SIMD Quintiles stated that they knew the rules in general but were not sure on the details. Respondents in higher areas of deprivation stated that they knew all of the rules slightly more than respondents in lower areas of deprivation.
SIMD Quintile 1 2 3 4 5
I don't know what the current rules are 3% 3% 3% 3% 2%
I know what the rules are in general, but I'm not sure on all the details 50% 52% 53% 55% 57%
I know what all the current rules are 47% 45% 44% 42% 41%
Sample Size 534 711 855 1031 1252
Age Group
Most respondents in all age groups stated that they knew the rules in general but were not sure on the details. The youngest and oldest respondents stated that they knew all of the rules slightly more than respondents aged 13 to 18.
Age Group 11 and 12 13 to 15 16 to 18 Over 18
I don't know what the current rules are 2% 3% 2% 3%
I know what the rules are in general, but I'm not sure on all the details 51% 56% 56% 50%
I know what all the current rules are 47% 41% 41% 47%
Sample Size 808 2359 1773 1098
Gender Identity
Female respondents and those who identified as non-binary or in another way mostly stated that they knew the rules in general but were not sure on the details. Male respondents mostly stated that they knew what all of the current rules were.
Gender Identity Female Male In another way/
Non-binary
I don't know what the current rules are 2% 3% 5%
I know what the rules are in general, but I'm not sure on all the details 55% 45% 53%
I know what all the current rules are 42% 52% 41%
Sample Size 3786 1953 148
Long-term Illness or Disability
Respondents with no long-term illness or disability stated that they knew all of the current rules more than those with a long-term illness or disability. This group mostly stated that they knew the rules in general but were not sure on the details.
Long-term illness or disability Long-term illness or disability No long-term illness or disability
I don't know what the current rules are 4% 3%
I know what the rules are in general, but I'm not sure on all the details 56% 43%
I know what all the current rules are 41% 54%
Sample Size 599 5084
Young Carers
Respondents who were young carers stated that they knew all of the rules slightly more than respondents who were not.
Young carer? Young carers Not a young carer
I don't know what the current rules are 3% 3%
I know what the rules are in general, but I'm not sure on all the details 47% 55%
I know what all the current rules are 50% 43%
Sample Size 352 5689
Care Experienced
Respondents in both groups mostly stated that they knew the rules in general but were not sure on the details.
Care experienced? Care experienced Not care experienced
I don't know what the current rules are 5% 3%
I know what the rules are in general, but I'm not sure on all the details 51% 54%
I know what all the current rules are 45% 43%
Sample Size 307 5734
Ethnic Group
Respondents in both groups mostly stated that they knew the rules in general but were not sure on the details.
Ethnic Group White BAME
I don't know what the current rules are 2% 3%
I know what the rules are in general, but I'm not sure on all the details 55% 54%
I know what all the current rules are 43% 43%
Sample Size 5492 334
Do you have access to a smartphone/tablet or computer at home that has reliable and sufficient broadband/data?
SIMD Quintile
Respondents in areas of higher deprivation had marginally less access compared to those in areas of lower deprivation.
SIMD Quintile Yes No Sample Size
1 96% 4% 534
2 96% 4% 711
3 97% 3% 855
4 98% 2% 1031
5 98% 2% 1252
Age Group
Results were the same for all age groups.
Age Group Yes No Sample Size
11 and 12 97% 3% 807
13 to 15 97% 3% 2359
16 to 18 97% 3% 1773
Over 18 97% 3% 1098
Gender Identity
Respondents who identified as non-binary or in another way stated that they had less access compared to female or male respondents.
Gender Identity Yes No Sample Size
Female 98% 2% 3785
Male 97% 3% 1953
In another way/Non-binary 91% 9% 148
Long-term Illness or Disability
Respondents with a long-term illness or disability stated that they had slightly less access than those who did not.
Long-term illness or disability Yes No Sample Size
Long-term illness or disability 94% 6% 599
No long-term illness or disability 98% 2% 5083
Young Carers
Respondents who were young carers stated that they had marginally less access than those who did not.
Young carer? Yes No Sample Size
Young carers 94% 6% 352
Not a young carer 97% 3% 5688
Care Experienced
Respondents who were care experienced stated that they had marginally less access than those who did not.
Care experienced? Yes No Sample Size
Care experienced 93% 7% 307
Not care experienced 97% 3% 5733
Ethnic Group
There was no discernible difference in access between ethnic groups.
Ethnic Group Yes No Sample Size
White 98% 2% 5491
BAME 97% 3% 334
Do you have access to a smartphone/tablet or computer within your local community that has reliable and sufficient broadband/data?
SIMD Quintile
Respondents in areas of higher deprivation had marginally less access compared to those in areas of lower deprivation.
SIMD Quintile Yes No Sample Size
1 84% 16% 534
2 86% 14% 711
3 85% 15% 855
4 87% 13% 1031
5 88% 12% 1252
Age Group
Respondents over the age of 18 stated that they had less access than younger age groups.
Age Group Yes No Sample Size
11 and 12 88% 12% 807
13 to 15 88% 12% 2359
16 to 18 87% 13% 1773
Over 18 78% 22% 1098
Gender Identity
Non-binary respondents and those who identified in another way stated that they had less access compared to female or male respondents.
Gender Identity Yes No Sample Size
Female 85% 15% 3785
Male 89% 11% 1953
In another way/Non-binary 73% 27% 148
Long-term Illness or Disability
Respondents with a long-term illness or disability had less access than those who did not.
Long-term illness or disability Yes No Sample Size
Long-term illness or disability 78% 22% 599
No long-term illness or disability 87% 13% 5083
Young Carers
Respondents who were young carers stated that they had slightly less access than those who did not.
Young carer? Yes No Sample Size
Young carers 80% 20% 352
Not a young carer 86% 14% 5688
Care Experienced
Respondents who were care experienced stated that they had slightly less access than those who did not.
Care experienced? Yes No Sample Size
Care experienced 81% 19% 307
Not care experienced 86% 14% 5733
Ethnic Group
White respondents stated that they had less access than BAME respondents.
Ethnic Group Yes No Sample Size
White 86% 14% 5491
BAME 90% 10% 334
Do you have any further thoughts about accessing information about coronavirus?
SIMD Quintile
There were not enough responses from those in SIMD Quintile 1 for this question so this group has been removed.
The most common theme from respondents in all Quintiles was that information is confusing and needs to be more accessible. Responses were mixed between Quintiles with no real pattern between levels of deprivation.
Theme 2 3 4 5
Confusing information (including need for Scotland-specific info) and the need to be more accessible 6% 13% 18% 20%
Ideas about how to make info more accessible 1% 8% 8% 9%
Poor Wi-Fi and lack of access to computers 4% 7% 9% 6%
General comments on COVID-19 and governmental response 4% 2% 3% 11%
Information is clear and accessible 3% 3% 3% 8%
Concern about misinformation and lack of trust 3% 3% 2% 2%
Sample Size 120 148 164 241
Age Group
The most common theme from the majority of groups was that that information is confusing and needs to be more accessible. This was expressed most by respondents over 16, who provided more responses than the other groups. Conversely, respondents aged 11 and 12 mostly thought that information is clear and accessible.
Theme 11 and 12 13 to 15 16 to 18 Over 18
Confusing information (including need for Scotland-specific info) and the need to be more accessible 2% 5% 16% 38%
Ideas about how to make info more accessible 1% 4% 8% 10%
Poor Wi-Fi and lack of access to computers 1% 2% 7% 12%
General comments on COVID-19 and governmental response 1% 2% 8% 9%
Information is clear and accessible 3% 1% 3% 4%
Concern about misinformation and lack of trust 0% 0% 4% 9%
Sample Size 213 497 160 150
Gender Identity
There were not enough responses from those who identified as non-binary or in another way for this question so this group has been removed.
The most common theme from respondents of both gender groups was that information is confusing and needs to be more accessible. Female respondents provided more responses for this theme than male. They also mentioned poor Wi-Fi and lack of access to computers slightly more than male respondents.
Theme Female Male
Confusing information (including need for Scotland-specific info) and the need to be more accessible 15% 6%
Ideas about how to make info more accessible 5% 4%
Poor Wi-Fi and lack of access to computers 6% 1%
General comments on COVID-19 and governmental response 4% 4%
Information is clear and accessible 2% 3%
Concern about misinformation and lack of trust 2% 2%
Sample Size 528 421
Long-term Illness or Disability
The most common theme from respondents in both groups was that information is confusing and needs to be more accessible. Respondents who had a long-term illness or disability also highlighted a lack of access to Wi-Fi and computers more than the other group.
Theme Long-term illness or disability No long-term illness or disability
Confusing information (including need for Scotland-specific info) and the need to be more accessible 14% 11%
Ideas about how to make info more accessible 4% 5%
Poor Wi-Fi and lack of access to computers 14% 3%
General comments on COVID-19 and governmental response 6% 4%
Information is clear and accessible 2% 3%
Concern about misinformation and lack of trust 3% 2%
Sample Size 109 828
Young Carers
There were not enough responses from young carers to this question, so this comparison has not been reported.
Care Experienced
There were not enough responses from care experienced young people to this question, so this comparison has not been reported.
Ethnic Group
There were not enough responses from those in the BAME ethnic groups. Therefore, no comparison will be done for this question according to ethnic group.
Get in touch to let us know what you think:
We would be delighted to hear what you think about #LockdownLowdown! Tweet using the #LockdownLowdown tagging @OfficialSYP @YouthLinkScot @YoungScot.
You can also let us know your thoughts on the issues raised in this report by emailing:
• Rosy Burgess, Scottish Youth Parliament, rosy.b@syp.org.uk
• Sarah Paterson, YouthLink Scotland, spaterson@youthlinkscotland.org
• Reid Aiton, Young Scot, reida@young.scot